Making interactive maps using Leaflet and related JavaScript libraries
In this session we will use the Leaflet JavaScript code library and its plugins/extensions to make web pages featuring interactive online maps. This can enable more precise control of a map’s features than is possible using a simple iframe embed.
Leaflet can work with locally-hosted GeoJSON data, plus GeoJSON obtained in real time from an API. This means that you can make maps without external hosting of your map data layers, and maps that will automatically update to reflect changes to the underlying data.
(Note that if you are making many online maps with CartoDB, you will fairly soon exceed the storage limits for a free account. Also, while CartoDB does allow you to create synced tables that will update to reflect changes in the data, this option is available only with a paid account.)
We will start by creating versions of the seismic risk and historical quakes maps we made this morning in CartoDB using locally hosted GeoJSON and data returned from the U.S. Geological Survey’s earthquakes API.
Then we will use CartoDB.js, which is very similar to Leaflet, to make a web page including both of the storm maps we made in this morning’s CartoDB session. We will use code that will let the user filter the storm tracks to view either all storm tracks from 1990 to 2013, or just those from the tumultuous 2005 hurricane season.
As we will be writing and editing the code for web pages, you should work with a text editor optimized for authoring HTML and JavaScript. I recommend TextWrangler for those of you working on a Mac, and Notepad++ for those on Windows machines.
Introducing Leaflet
Leaflet is the most widely-used open source JavaScript code library for making interactive online maps. The core library has most of the features that you need to make basic maps.
Leaflet can also be extended with a host of plugins that extend its functionality to display and process geodata in a variety of ways. If you cannot find the function you are looking for in the basic Leaflet documentation, search the plugins!
To enable Leaflet for any web page, include the following links between its <head> </head> tags:
<link rel='stylesheet' href='http://cdn.leafletjs.com/leaflet-0.7.3/leaflet.css' />
<script src='http://cdn.leafletjs.com/leaflet-0.7.3/leaflet.js'></script>
You can also download the latest stable version from here and host the files yourself, again linking to them from the head of your web page.
To add CartoDB.js to a web page, include these two links in its head:
<link rel='stylesheet' href='http://libs.cartocdn.com/cartodb.js/v3/3.11/themes/css/cartodb.css' />
<script src='http://libs.cartocdn.com/cartodb.js/v3/3.11/cartodb.js'></script>
(CartoDB.js also automatically loads jQuery, a JavaScript code library widely used for manipulating elements on web pages.)
The data we will use
Download the data from this session from here, unzip the folder and place it on your desktop. It contains the following:
Earthquakes
This in turn contains:
dataFolder with a single file,seismic_risk.js. This is the seismic risk GeoJSON data we earlier imported into CartoDB, declared as a JavaScript variable by pasting it into the following code:var seismic_risk = //GeoJSON pasted here ;When we link to this file from our web page, we can refer to the variable
seismic_risk, which will be the GeoJSON data needed to make the seismic risk map.srcFolder with two JavaScript files,date-format.jsandleaflet.ajax.min.js. The first is a script by web developer Steven Levithan, which we will use to format dates. The second is a Leaflet plugin, which we will use to turn GeoJSON returned by an API into a Leaflet map layer.
Make an online map of seismic risk in the continental United States
First we need to set up a web page for our map. In your text editor, paste the following into a new document, saving it as index.html in the main earthquakes folder:
<!DOCTYPE html>
<html>

</html>
Now paste the following code, for the head of the web page, between the <html> </html> tags:
<head>

    <meta charset=utf-8 />
    <title>Seismic hazards in the continental U.S.</title>
    <meta name='viewport' content='initial-scale=1,maximum-scale=1,user-scalable=no' />
    <link rel='stylesheet' href='http://cdn.leafletjs.com/leaflet-0.7.3/leaflet.css' />
    <script src='http://cdn.leafletjs.com/leaflet-0.7.3/leaflet.js'></script>
    <script src='data/seismic_risk.js'></script>

    <style>
        body {margin:0; padding:0;}
        #map {position:absolute; top:0; bottom:0; width:100%;}
        #legend {
            background: #ffffff;
            position: absolute;
            bottom: 30px;
            left: 10px;
            padding: 0px 10px;
            width: 200px;
            font-family: arial;
            font-size: small;
            -webkit-border-radius:4px 4px 4px 4px;
            border-radius:4px 4px 4px 4px;
            -webkit-box-shadow: 0px 1px 5px rgba(153,153,153,1);
            -moz-box-shadow: 0px 1px 5px rgba(153,153,153,1);
            box-shadow: 0px 1px 5px rgba(153,153,153,1);
        }
    </style>

</head>
This loads the resources we will need to make the seismic risk map, including Leaflet and its associated CSS stylesheet, plus the GeoJSON data.
The CSS between the <style> </style> tags will make the map display over the entire web page, and also contains style for a legend, which will make it look consistent with Leaflet’s map controls. (All of this CSS could be placed into an external stylesheet, if you wished.)
Now, beneath the head, but above the closing </html> tag, paste the following HTML for the body of the web page:
<body>

    <div id='map'>

        <script src='src/maps.js'></script>

    </div>

    <div id='legend'>
        <p><strong>Seismic risk:</strong></p>
        <p>Low
        <span style='color:#fee5d9'>▉</span>
        <span style='color:#fcae91'>▉</span>
        <span style='color:#fb6a4A'>▉</span>
        <span style='color:#de2d26'>▉</span>
        <span style='color:#a50f15'>▉</span>
        High</p>
    </div>

</body>
Note that there are two main divs on the page, which have ids of map and legend respectively.
The HTML code in the legend div uses UTF-8 black square characters to create colored boxes for the legend, with the same ColorBrewer reds sequential color scheme that we used to make the CartoDB map.
There is a div called map to contain the map, which links to a file that we now need to create, called maps.js. So open a new document in your text editor, and save it under this name in the src subfolder.
Now paste the following into the maps.js file:
var map = L.map('map').setView([40, -100], 4);
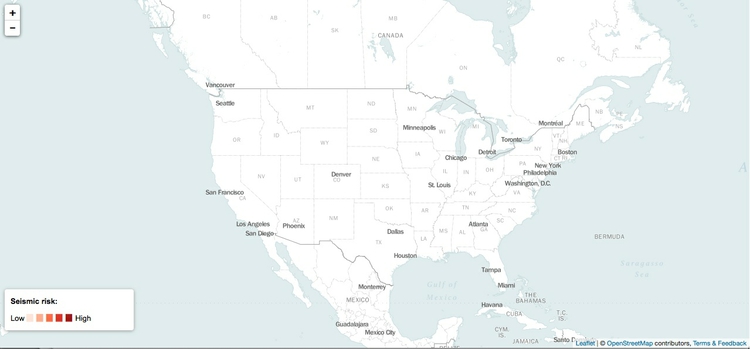
This Leaflet code creates a map object in the map div of the web page. It sets its zoom level to 4, which will give a good view of the entire continental United States, and it centers the map at a latitude of 40 degrees and a longitude of -100 degrees.
Now add the MapBox World Bright tiled basemap, and a link for its attribution, by pasting the following Leaflet code into maps.js:
L.tileLayer('https://{s}.tiles.mapbox.com/v3/mapbox.world-bright/{z}/{x}/{y}.png', {
attribution: '<a href="http://www.mapbox.com/about/maps/" target"_blank">Terms & Feedback</a>'
}).addTo(map);
Save both index.html and maps.js files and open the former in a web browser. The map should now look like this:
Next we will add a GeoJSON layer with the seismic risk data by pasting the following code at the bottom of the maps.js file.
L.geoJson(seismic_risk).addTo(map);
Note that this is using the variable seismic_risk, declared in the seismic_risk.js file.
Save the maps.js file the refresh index.html in your browser, and the map should look like this:

This is how unstyled GeoJSON appears on a Leaflet map, so now we need to style it. To do that, remove the single line of code creating the GeoJSON layer, and replace it with this:
// functions to style the seismic risk layer
function getColor(a) {
            return a > 79 ? '#a50f15':
                   a > 59 ? '#de2d26' :
                   a > 39  ? '#fb6a4A' :
                   a > 19 ? '#fcae91' :
                   '#fee5d9';
            }

function getStyle(feature) {
                return {
                    fillColor: getColor(feature.properties.ACC_VAL),
                    color: getColor(feature.properties.ACC_VAL),
                    weight: 1,
                    opacity: 0.4,
                    fillOpacity: 0.7
                };
            }


// the seismic risks layer, styled using functions above
L.geoJson(seismic_risk, {style:getStyle}).addTo(map);
The getColor function is fairly easy to understand: it gets the HEX values for the same ColorBrewer color scheme we used previously, according to the values listed.
The getStyle function applies getColor to values for ACC_VAL in the data, so that these colors are assigned to both the lines and the fill for the polygons. Here is the GeoJSON for one of the polygons in the seismic risk data, which should make the logic of feature.properties.ACC_VAL easy to follow:
{ "type": "Feature", "properties": { "ACC_VAL": 18, "VALLEY": 0 }, "geometry": { "type": "Polygon", "coordinates": [ [ [ -78.0, 37.365031051635675 ], [ -78.017343139648474, 37.367344284057566 ], [ -78.03101501464846, 37.368985366821327 ], [ -78.1, 37.378542709350597 ], [ -78.116345214843804, 37.383655929565464 ], [ -78.143249511718778, 37.393249893188475 ], [ -78.153375244140662, 37.396623611450167 ], [ -78.162326049804719, 37.400000381469681 ], [ -78.189303588867219, 37.410696029663058 ], [ -78.2, 37.415526199340775 ], [ -78.221560668945358, 37.428441238403309 ], [ -78.251376342773483, 37.448622512817352 ], [ -78.28023071289067, 37.469771194458019 ], [ -78.3, 37.486327743530268 ], [ -78.307220458984403, 37.492779159545904 ], [ -78.31434020996096, 37.500000381469711 ], [ -78.328512573242222, 37.52148780822754 ], [ -78.338735961914111, 37.538737106323218 ], [ -78.347268676757835, 37.552730941772467 ], [ -78.365298461914108, 37.584701156616219 ], [ -78.373092651367216, 37.600000381469691 ], [ -78.384274291992242, 37.700000381469692 ], [ -78.376583862304742, 37.726585769653305 ], [ -78.364724731445349, 37.764723587036102 ], [ -78.352359008789094, 37.800000381469708 ], [ -78.330413818359403, 37.830413436889629 ], [ -78.307797241210977, 37.857796096801799 ], [ -78.3, 37.866172409057668 ], [ -78.282803344726617, 37.882802963256815 ], [ -78.262322998046912, 37.900000381469667 ], [ -78.255227661132849, 37.905229568481374 ], [ -78.225012207031298, 37.925011825561469 ], [ -78.2, 37.939875411987288 ], [ -78.192904663085983, 37.942905044555616 ], [ -78.156692504882855, 37.956692123413085 ], [ -78.136401367187545, 37.963599014282224 ], [ -78.119662475585969, 37.969662094116181 ], [ -78.1, 37.975945663452194 ], [ -78.034487915039108, 37.984489059448194 ], [ -78.0, 37.988642501831045 ], [ -77.9, 37.981746292114266 ], [ -77.87483520507817, 37.975164413452106 ], [ -77.835671997070349, 37.964329910278302 ], [ -77.8, 37.95324516296386 ], [ -77.797760009765668, 37.952238845825171 ], [ -77.764578247070361, 37.935423660278325 ], [ -77.732861328125054, 37.917139053344741 ], [ -77.706625366210972, 37.900000381469667 ], [ -77.702761840820344, 37.897238540649404 ], [ -77.7, 37.894968795776357 ], [ -77.677008056640673, 37.872991561889677 ], [ -77.653109741210969, 37.846889114379856 ], [ -77.630596923828179, 37.819403457641613 ], [ -77.616723632812537, 37.800000381469708 ], [ -77.611972045898469, 37.788029098510783 ], [ -77.59919433593754, 37.750805282592765 ], [ -77.586868286132841, 37.713131332397516 ], [ -77.583099365234418, 37.700000381469692 ], [ -77.593188476562545, 37.600000381469691 ], [ -77.595449829101597, 37.595450210571244 ], [ -77.612869262695341, 37.56286964416509 ], [ -77.631304931640656, 37.53130607604983 ], [ -77.651373291015673, 37.500000381469711 ], [ -77.676461791992224, 37.476461410522433 ], [ -77.7, 37.456859207153336 ], [ -77.703982543945358, 37.453983688354448 ], [ -77.73429870605473, 37.434299087524423 ], [ -77.765908813476599, 37.415910720825217 ], [ -77.796795654296929, 37.40000038146971 ], [ -77.8, 37.3985080718994 ], [ -77.837515258789097, 37.387516403198234 ], [ -77.876998901367216, 37.376997756957984 ], [ -77.9, 37.371197891235305 ], [ -78.0, 37.365031051635675 ] ], [ [ -78.0, 37.425953292846657 ], [ -77.9, 37.433411788940397 ], [ -77.887353515625023, 37.437353134155259 ], [ -77.85, 37.449983596801772 ], [ -77.813735961914105, 37.46373786926268 ], [ -77.8, 37.469122695922827 ], [ -77.78084106445317, 37.480842971801749 ], [ -77.751492309570352, 37.500000381469697 ], [ -77.727679443359406, 37.5276798248291 ], [ -77.70921325683598, 37.550000381469644 ], [ -77.7, 37.561656570434536 ], [ -77.684979248046929, 37.584979629516589 ], [ -77.675885009765665, 37.600000381469691 ], [ -77.666900634765668, 37.700000381469692 ], [ -77.676461791992224, 37.723538589477528 ], [ -77.687655639648483, 37.75000038146969 ], [ -77.691400146484412, 37.758599472045923 ], [ -77.7, 37.776056289672859 ], [ -77.708975219726597, 37.791025924682565 ], [ -77.714547729492224, 37.800000381469708 ], [ -77.733038330078159, 37.816961288452141 ], [ -77.75, 37.831132888793981 ], [ -77.760403442382852, 37.839598464965789 ], [ -77.773834228515668, 37.850000381469719 ], [ -77.788818359375028, 37.861182022094717 ], [ -77.8, 37.868613815307633 ], [ -77.822052001953153, 37.877946853637681 ], [ -77.857522583007849, 37.892478561401362 ], [ -77.876547241210972, 37.900000381469667 ], [ -77.89393920898442, 37.906061935424759 ], [ -77.9, 37.907944107055656 ], [ -77.938540649414094, 37.91146049499514 ], [ -78.0, 37.916647720336911 ], [ -78.057867431640673, 37.907867813110393 ], [ -78.1, 37.900716781616204 ], [ -78.101760864257841, 37.900000381469667 ], [ -78.134426879882867, 37.884426498413127 ], [ -78.167617797851591, 37.867616653442333 ], [ -78.2, 37.849556350707999 ], [ -78.226348876953168, 37.826350021362302 ], [ -78.25, 37.804281234741175 ], [ -78.254208374023477, 37.800000381469708 ], [ -78.269543457031304, 37.769543838501008 ], [ -78.278686523437528, 37.75000038146969 ], [ -78.285430908203168, 37.735432052612317 ], [ -78.3, 37.702294540405298 ], [ -78.300872802734403, 37.700000381469692 ], [ -78.288168334960986, 37.600000381469691 ], [ -78.272650146484423, 37.577350234985381 ], [ -78.251855468750037, 37.54814491271965 ], [ -78.229464721679733, 37.520535659789999 ], [ -78.212561035156298, 37.500000381469711 ], [ -78.205477905273469, 37.494522476196252 ], [ -78.2, 37.490776443481408 ], [ -78.17280273437504, 37.477198410034219 ], [ -78.139053344726605, 37.460947799682621 ], [ -78.115493774414105, 37.450000381469707 ], [ -78.104769897460983, 37.445229721069339 ], [ -78.1, 37.443348312377921 ], [ -78.06331176757817, 37.436689376831055 ], [ -78.0, 37.425953292846657 ] ] ] } }
When writing JavaScript code for custom functions, you can call the functions what you like. I chose getColor and getStyle to make it obvious what they do.
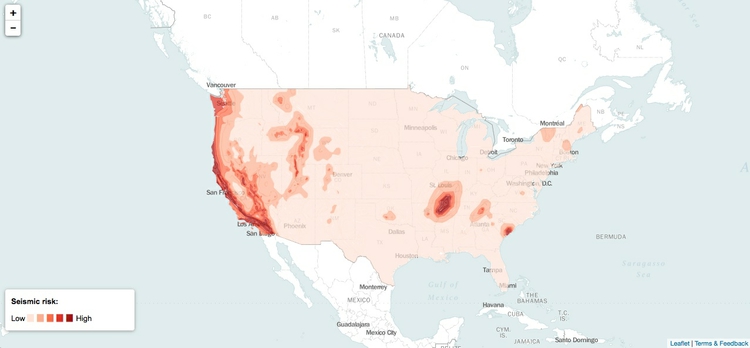
In addition, weight sets the width of the lines, opacity sets their transparency, and fillOpacity sets the transparency for the polygon fills. I settled on these values through trial and error, seeking the most attractive display.
The last line creates the seismic risk layer as before, but this time applies the getStyle function to style the GeoJSON. Save the maps.js file, refresh index.html in your browser, and the map should look like this:
This is the complete code you need to display a tiled basemap with a styled GeoJSON data overlay using Leaflet:
var map = L.map('map').setView([40, -100], 4);
L.tileLayer('https://{s}.tiles.mapbox.com/v3/mapbox.world-bright/{z}/{x}/{y}.png', {
attribution: '<a href="http://www.mapbox.com/about/maps/" target"_blank">Terms & Feedback</a>'
}).addTo(map);
function getColor(a) {
return a > 79 ? '#a50f15':
a > 59 ? '#de2d26' :
a > 39 ? '#fb6a4A' :
a > 19 ? '#fcae91' :
'#fee5d9';
}
function getStyle(feature) {
return {
fillColor: getColor(feature.properties.ACC_VAL),
color: getColor(feature.properties.ACC_VAL),
weight: 1,
opacity: 0.4,
fillOpacity: 0.7
};
}
L.geoJson(seismic_risk, {style:getStyle}).addTo(map);
Now we will make a more complex map, incorporating the same layers as before, but including an alternate basemap and historical earthquakes, called from the USGS API.
The code we will use to do this is subtly different, so delete the contents of maps.js and start with a blank file. Instead of creating the map, and then adding layers, we are going to first declare the layers as variables, so that we can then create the map and add the layers using a control that allows them to be turned on and off. (For this to work, they have to be given names that we can refer to.)
First, paste the following into the maps.js file:
// creates two basemap layers
var bright = L.tileLayer("https://{s}.tiles.mapbox.com/v3/mapbox.world-bright/{z}/{x}/{y}.png", {
attribution: '<a href="http://www.mapbox.com/about/maps/" target="_blank">Terms & Feedback</a>'
});
var satellite = L.tileLayer("https://{s}.tiles.mapbox.com/v3/mapbox.blue-marble-topo-jul-bw/{z}/{x}/{y}.png", {
attribution: '<a href="http://www.mapbox.com/about/maps/" target="_blank">Terms & Feedback</a>'
});
This declares two JavaScript variables, bright and satellite, which correspond to MapBox tiled basemaps, converted to Leaflet map layers. As we discussed in the cartoDB session this morning, you can add any public tiled basemap using its XYZ URL.
Now paste this code into the file:
// creates the map and sets initial view, including layers to be displayed, plus limits for zoom and maximum extent
var map = L.map('map', {
    center: new L.LatLng(40, -100),
    zoom: 4,
    maxZoom: 6,
    minZoom: 3,
    maxBounds: ([
    [-10, -160],
    [70, -40]
    ]),
    layers: [bright]
});
This creates the map, setting its initial zoom level to 4, and the minimum and maximum zoom levels to 3 and 6 respectively. It centers the initial view at a latitude of 40 degrees and a longitude of -100 degrees.
maxBounds sets southwest and northeast co-ordinates for the maximum extent of the map view: If a user tries to pan the map beyond these limits, it will spring back to the allowed view. layers loads the bright layer we created above.
Save maps.js and refresh index.html in your browser. Experiment with panning and zooming the map to see the effect of the code you have just added.
Next, paste this code at the bottom of the maps.js file:
// Defines the two basemaps
var baseMaps = {
    'Satellite': satellite,
    'Map': bright
};

// Defines the overlay maps. For now this variable is empty, because we haven't created any overlay layers
var overlayMaps = {

};

// Adds a Leaflet layer control, using basemaps and overlay maps defined above
var layersControl = new L.Control.Layers(baseMaps, overlayMaps, {collapsed: false});
map.addControl(layersControl);
This code sets up a Leaflet layer-switching control, and tells it that bright and satellite should be used as the basemaps. Save maps.js, refresh index.html in your browser and notice that you can now switch between the two basemaps using the control at top right:

See what happens if you replace {collapsed: false} with {collapsed: true} in the layersControl code.
Now, immediately below the code that declared the bright and satellite variables used for the basemaps, add the code to create and style the seismic risk layer:
// functions to style the seismic risk layer
function getColor(a) {
            return a > 79 ? '#a50f15':
                   a > 59 ? '#de2d26' :
                   a > 39  ? '#fb6a4A' :
                   a > 19 ? '#fcae91' :
                   '#fee5d9';
            }

function getStyle(feature) {
                return {
                    fillColor: getColor(feature.properties.ACC_VAL),
                    color: getColor(feature.properties.ACC_VAL),
                    weight: 1,
                    opacity: 0.4,
                    fillOpacity: 0.7
                };
            }


// the seismic risks layer, styled using functions above
var seismic = L.geoJson(seismic_risk, {style:getStyle});
This is the same as the code we used previously, except that it declares the geoJSON layer as a variable called seismic, rather than adding it directly to the map.
So now we need to add it to the map, both on initial view, and in the layers control.
First edit the code that creates the initial map to the following:
var map = L.map('map', {
    center: new L.LatLng(40, -100),
    zoom: 4,
    maxZoom: 6,
    minZoom: 3,
    maxBounds: ([
    [-10, -160],
    [70, -40]
    ]),
    layers: [bright, seismic]
});
Then edit the code defining the overlay maps:
var overlayMaps = {
     'Seismic risk': seismic
};
Save maps.js, refresh index.html in your browser, and the map should look like this:
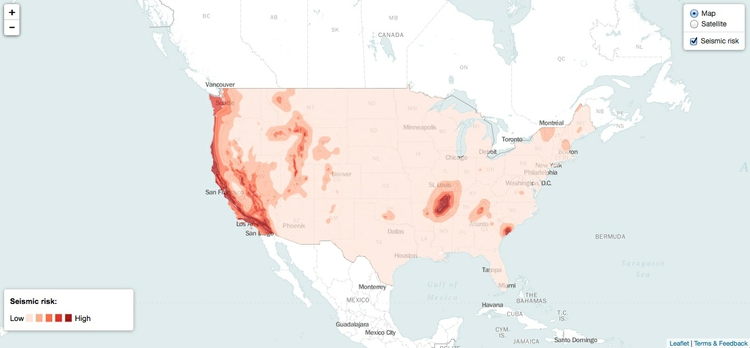
Notice that the seismic risk layer can now be turned on and off using the layers control.
Now we need to to add the layer for the quakes, which is achieved with this code. Paste it immediately beneath the code declaring the seismic variable:
// the url to send to the USGS API
var quakedataUrl = "http://comcat.cr.usgs.gov/fdsnws/event/1/query?starttime=1965-01-01T00:00:00&minmagnitude=6&format=geojson&latitude=39.828175&longitude=-98.5795&maxradiuskm=6000&orderby=magnitude&callback="


// the quakes layer, uses leaflet.ajax to make API call
var quakes = L.geoJson.ajax(quakedataUrl, {

            dataType:'jsonp',

            // makes points into circle markers and styles them, scaling using JavaScript Math; magnitude value for each quake from parsed JSON
            pointToLayer: function (feature, latlng) {
                return L.circleMarker(latlng, {
                    radius: Math.sqrt(Math.pow(10, feature.properties.mag)/50000),
                    fillColor: '#fff',
                    color: '#000',
                    weight: 1,
                    opacity: 0.2,
                    fillOpacity: 0.5
                });
            }
            });
This code starts by declaring the variable quakedataUrl, which will return from the U.S. Geological Survey earthquakes API GeoJSON for quakes over the same area as we considered previously. This time I have asked for quakes of magnitude 6 and above, to limit the amount of data returned, which will help the map load more quickly — you can experiment with different values. I have set the start date as the beginning of 1965 with no end date, which means the map will always include the most recent quakes in the USGS data each time it loads.
The second section of code uses the Leaflet Ajax plugin, in the file leaflet.ajax.min.js, to call the USGS API and convert the data returned into a Leaflet GeoJSON layer. The pointToLayer function turns each feature into a circle marker, styled as defined in the code.
Here is the GeoJSON for one of the quakes, which should make the code easier to follow:
{"type":"Feature","properties":{"mag":6.5,"place":"Seattle-Tacoma urban area, Washington","time":-147515475000,"updated":1408399017684,"tz":null,"url":"http://comcat.cr.usgs.gov/earthquakes/eventpage/centennial19650429152845","detail":"http://comcat.cr.usgs.gov/fdsnws/event/1/query?eventid=centennial19650429152845&format=geojson","felt":175,"cdi":8.6,"mmi":7.19,"alert":null,"status":"reviewed","tsunami":null,"sig":800,"net":"centennial","code":"19650429152845","ids":",uutacoma65,atlas19650429152845,centennial19650429152845,","sources":",uu,atlas,centennial,","types":",dyfi,origin,shakemap,trump,","nst":203,"dmin":null,"rms":null,"gap":null,"magType":"mb","type":"earthquake","title":"M 6.5 - Seattle-Tacoma urban area, Washington"},"geometry":{"type":"Point","coordinates":[-122.333,47.317,65.7]},"id":"centennial19650429152845"}
Scroll to the right of this code, and notice that the quake has three coordinates: The first two are its longitude and latitude; the third is its depth in kilometers. latlng centers each circle on the latitude and longitude coordinates.
fillColor, color, weight, opacity and fillOpacity are doing the same jobs as in the code that styled the seismic risk layer.
The size of the circles is set by this line of code:
radius: Math.sqrt(Math.pow(10, feature.properties.mag)/50000),
This uses JavaScript Math to scale the circles according to their magnitude, or mag, so that their area corresponds to the amount of ground shaking. Leaflet sets the size of a circle by its radius, so to do this we need to raise ten to the power of each quake’s magnitude, and then take the square root of this number. I also divided by 50,000 to give the circles a reasonable size when added to the map. I settled on this value by trial and error.
For this code to work, we need to link to the leaflet.ajax.min.js file, so add this code to the head of index.html, immediately beneath the link to the siesmic_risk.js file:
<script src='src/leaflet.ajax.min.js'></script>
Again, add the new quakes layer to the layers that will display when the map loads:
var map = L.map('map', {
    center: new L.LatLng(40, -100),
    zoom: 4,
    maxZoom: 6,
    minZoom: 3,
    maxBounds: ([
    [-10, -160],
    [70, -40]
    ]),
    layers: [bright, seismic, quakes]
});
Also add it to the code defining the overlay maps:
var overlayMaps = {
    'Seismic risk': seismic,
    'Earthquakes': quakes
};
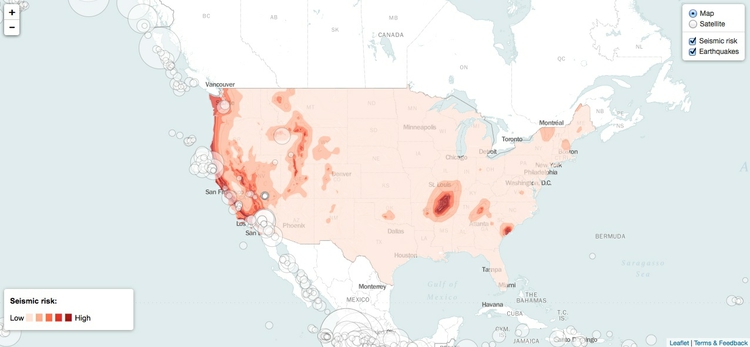
Save your files and refresh index.htm in your browser, and the map should now look like this:
Next we will add a pop-up to appear when each quake is clicked, giving information on its date, depth and magnitude.
Immediately beneath the code you just added, paste the following:
// function to write html for pop-ups; date, magnitude and depth values for each quake from parsed JSON
function popupText (feature, layer) {
     var date = new Date(feature.properties.time)
     // uses date-format to format the date
     var dateString = date.format('mmm d, yyyy')
     layer.bindPopup('<strong>Date: </strong>' + dateString + '<br />'
                    + '<strong>Magnitude: </strong>' + feature.properties.mag + '<br />'
                    + '<strong>Depth: </strong>' + feature.geometry.coordinates[2] + ' kilometers')
}
The popupText function writes some HTML pop-ups that will appear when each quake is clicked.
JavaScript starts from zero when counting through items in an object, so feature.geometry.coordinates[2] returns the third item from the coordinates for each quake, which is the depth, as required.
Look again at the GeoJSON above, and you will see no date, but instead a time, given as -147515475000. JavaScript calculates dates and time in milliseconds, relative to the start of 1970. Here is how to convert a JavaScript time to a date, demonstrated at JSFiddle:
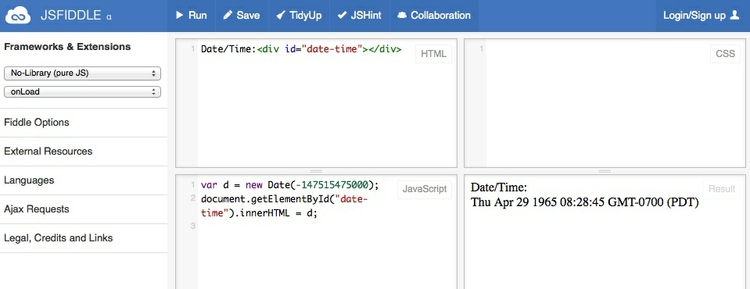
Notice that the popupText function similarly uses new Date to convert the JavaScript times into dates, and then formats these using the date.format function, from the script in the date.format.js file. So we also need to include a link to this file, by pasting this code into the head of the index.html, immediately beneath the link to the Leaflet Ajax plugin:
<script src='src/date.format.js'></script>
See here for a complete reference on formatting dates and times with date.format.
To apply the popupText function to all of the quakes, paste the following into the code that processes the GeoJSON from the API, immediately beneath dataType:'jsonp':
            // calls the function below to create a pop-up for each quake when clicked
            onEachFeature: popupText,
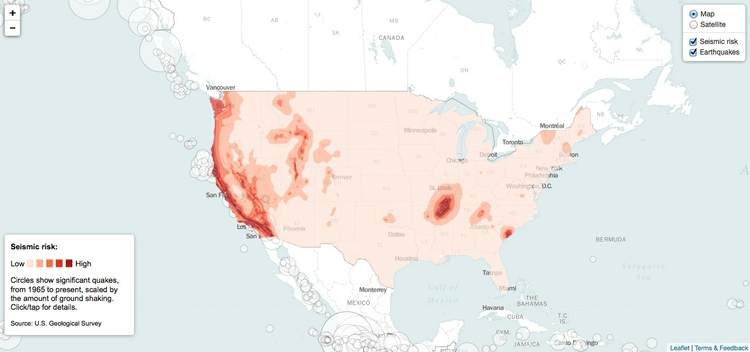
Save the files, refresh your browser and the quakes should now display a pop-up window when clicked:

Now we need to edit the legend to describe the new quakes layer. Edit its code at index.html to the following:
    <div id='legend'>
        <p><strong>Seismic risk:</strong></p>
        <p>Low
        <span style='color:#fee5d9'>▉</span>
        <span style='color:#fcae91'>▉</span>
        <span style='color:#fb6a4A'>▉</span>
        <span style='color:#de2d26'>▉</span>
        <span style='color:#a50f15'>▉</span>
        High</p>
        <div id='legend-text'>
            <p>Circles show significant quakes, from 1965 to present, scaled by the amount of ground shaking. Click/tap for details.</p>
        </div>
        <div id='legend-text-alt'>
            <p>Tap quakes for details.</p>
        </div>
        <p style="font-size: 11px">Source: U.S. Geological Survey<p>
    </div>
As well as adding source information for the data, notice that the revised legend includes two versions of the div containing the text describing the quakes, the second much condensed. This is intended for small screens. We can control which legend appears based on screen size by adding the following code in the head of the page, above the closing </style> tag:
        @media (max-width:767px) {
        #legend-text {display:none;}
        #legend {width: 140px;}
        }
        @media (min-width:768px) {
        #legend-text-alt {display:none;}
        }
Finally, paste this code at the end of the maps.js file, to give the map some basic responsive design, altering zoom level depending on the size of the user’s screen/browser windows:
// Uses jQuery to add some responsive design, resetting zoom levels for small and very large screens
function responsive() {
     width = $(window).width();
     height = $(window).height();
    if (width < 768) {
        // set the zoom level to 3
        map.setZoom(3);
    } else if (width > 1500) {
        // set the zoom level to 5
        map.setZoom(5);
    } else {
        map.setZoom(4);
    }
 }

  // applies the function above both on initial load and window resize
   $(window).ready(responsive).resize(responsive);
This code uses jQuery, so for it to work we will also need to add a link to the library in the head of the page, immediately beneath the link to date.format:
<script src='http://code.jquery.com/jquery.min.js'></script>
Save the maps.js file and refresh index.html in your web browser. The finished map should look like this:
Make a similar map from your CartoDB visualization
CartoDB.js is very similar to Leaflet, as you can see from the HTML code below, which will load the CartoDB visualization of seismic hazards and quakes we made this morning, and displat it on an entire web page. You will need to replace http://aldhouskdmc.cartodb.com/api/v2/viz/e7640620-935f-11e4-a70d-0e4fddd5de28/viz.json with the corresponding URL for your map. To retreive this, go to you CartoDB account, navigate to the visualization, then click the SHARE button and copy the CartoDB.js link.
Paste all of the code below, including the URL for your visualization, into a blank text file, save with an .html extension, then open in your web browser to view the map. Note that here the script to load and control the map is written between <script> </script> tags in the web page, rather than being called in from a separate file, like we did with the Leaflet map. Both work equally well — I tend to use a separate file if there is a larger amount of JavaScript code, to keep the HTML uncluttered.
<!DOCTYPE html>
<html>
<head>
<meta charset=utf-8 />
<title>Seismic hazards in the continental U.S.</title>
<meta name='viewport' content='initial-scale=1,maximum-scale=1,user-scalable=no' />
<link rel='stylesheet' href='http://libs.cartocdn.com/cartodb.js/v3/themes/css/cartodb.css' />
<script src='http://libs.cartocdn.com/cartodb.js/v3/cartodb.js'></script>
<style>
body {margin:0; padding:0;}
#map {position:absolute; top:0; bottom:0; width:100%;}
</style>
</head>
<body>
<div id='map'></div>
<script>
var map = new L.map('map').setView([40, -100], 4);
L.tileLayer('https://{s}.tiles.mapbox.com/v3/mapbox.world-bright/{z}/{x}/{y}.png', {
attribution: '<a href="http://www.mapbox.com/about/maps/" target="_blank">Terms & Feedback</a>'
}).addTo(map);
cartodb.createLayer(map, 'http://aldhouskdmc.cartodb.com/api/v2/viz/e7640620-935f-11e4-a70d-0e4fddd5de28/viz.json')
.addTo(map)
.on('done', function(layer) {
layer.setInteraction(true);
layer.on('featureOver', function(e, pos, latlng, data) {
cartodb.log.log(e, pos, latlng, data);
});
layer.on('error', function(err) {
cartodb.log.log('error: ' + err);
});
}).on('error', function() {
cartodb.log.log('some error occurred');
});
</script>
</body>
</html>
Combine the CartoDB storm visualizations into a single map
Now we will use CartoDB.js to combine both storm maps we made in this morning’s session. Start by pasting the following code into a blank text file and saving with an .html extension. This will load the animated storms over a dark CartoDB basemap.
The code is a little simpler than the example above, because we do not need to set up any pop-up interactivity. (Note that in the CSS I have given the map div a black background to prevent a momentary distracting flash of a blank white web page before the dark basemap loads.)
Use the CartoDB.JS URL for your animated map in place of http://aldhouskdmc.cartodb.com/api/v2/viz/1c2a6644-9390-11e4-ab08-0e4fddd5de28/viz.json.
<!DOCTYPE html>
<html>
<head>
<meta http-equiv='Content-Type' content='text/html; charset=UTF-8' />
<title>CartoDB storms</title>
<meta name='viewport' content='width=device-width, initial-scale=1.0'>
<link rel='stylesheet' href='http://libs.cartocdn.com/cartodb.js/v3/themes/css/cartodb.css' />
<script src='http://libs.cartocdn.com/cartodb.js/v3/cartodb.js'></script>
<style>
html, body {width:100%; height:100%; padding: 0; margin: 0;}
#map { width: 100%; height:100%; background: black;}
</style>
</head>
<body>
<div id='map'></div>
<script>
var map = new L.Map('map', {
center: [40,-50],
zoom: 3,
zoomControl: false,
scrollWheelZoom: false
});
L.tileLayer('http://{s}.basemaps.cartocdn.com/dark_all/{z}/{x}/{y}.png',{
attribution: '© <a href="http://www.openstreetmap.org/copyright">OpenStreetMap</a> contributors, © <a href="http://cartodb.com/attributions">CartoDB</a>'
}).addTo(map);
cartodb.createLayer(map, 'http://aldhouskdmc.cartodb.com/api/v2/viz/1c2a6644-9390-11e4-ab08-0e4fddd5de28/viz.json')
.addTo(map);
</script>
</body>
</html>
The initial map should look like this:
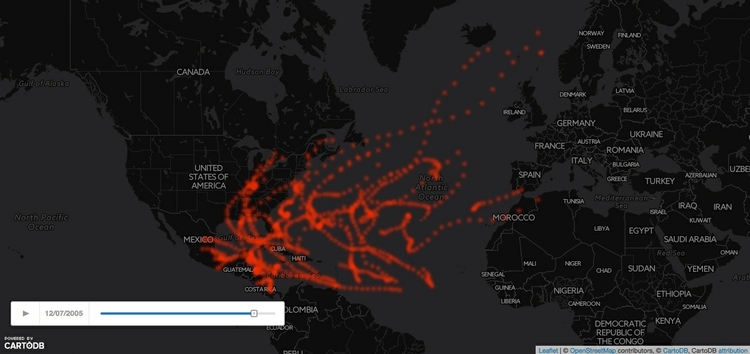
Next add the following code, immediately beneath the section that adds the basemap, to add the static storm tracks. Again, replace http://aldhouskdmc.cartodb.com/api/v2/viz/3d2e2e48-93a4-11e4-88e2-0e018d66dc29/viz.json with the CartoDB.js URL for your own storm tracks visualization.
        var layerUrl = 'http://aldhouskdmc.cartodb.com/api/v2/viz/3d2e2e48-93a4-11e4-88e2-0e018d66dc29/viz.json';

        var sublayers = [];

        cartodb.createLayer(map, layerUrl)
            .addTo(map)
            .on('done', function(layer) {
            // change the query for the first layer
            var subLayerOptions = {
              sql: 'SELECT * FROM storms_tracks',
            }

        var sublayer = layer.getSubLayer(0);

        sublayer.set(subLayerOptions);

        sublayers.push(sublayer);
        }).on('error', function() {
        //log the error
        });

        var LayerActions = {
            all: function(){
                sublayers[0].setSQL('SELECT * FROM storms_tracks');
                return true;
            },
            y2005: function(){
                sublayers[0].setSQL('SELECT * FROM storms_tracks WHERE year = 2005');
                return true;
            }
        }
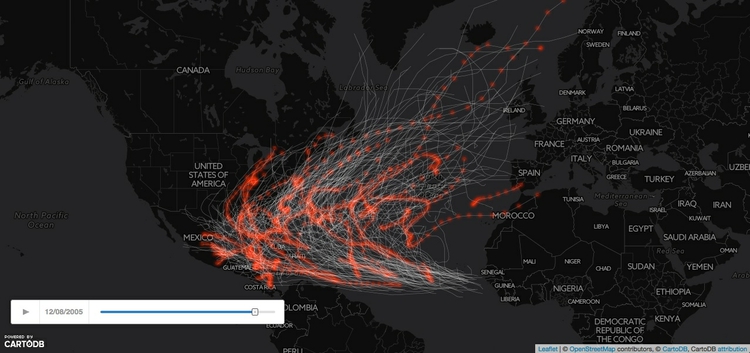
You will notice that this code is a little more complex, and contains some SQL. When the layer is first added to the map, the SQL used is SELECT * FROM storms_tracks, which loads all of the storm tracks. But further down, in the variable LayerActions, notice the query SELECT * FROM storms_tracks WHERE year = 2005, which will select just the storm tracks from 2005.
We need to set up controls to allow this query to be run. But before doing so, save the file and refresh your browser to confirm that the storm tracks have been added to the map:
Now create a control, by adding the following HTML after the map div:
    <div id='control'>
        <p>Show storm tracks:
            <select>
                <option value='all'>1990-2013</option>
                <option value='y2005'>2005 only</option>
            </select>
         </p>
     </div>
Also add this CSS immediately above the closing </style> tag to define its position and appearance:
#control {position: absolute; top: 5px; right:10px; color:#ccc; font-family:arial; font-size:small;}
Finally, add the following code to the script, immediately beneath the LayerActions variable, and above the code loading the animated map:
        $('select').change(function() {
        $('select').removeClass('selected');
        $(this).addClass('selected');
        LayerActions[$(this).attr('value')]();
        });
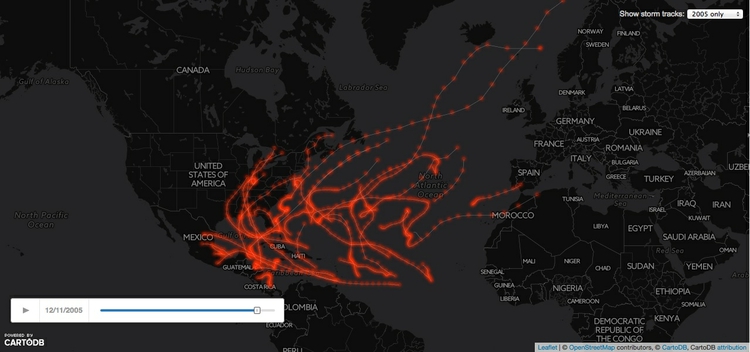
This is jQuery code, which listens for the value of the selection from the control, then feeds that to the functions in the LayerActions variable to run the corresponding SQL and change the map accordingly. Save the file, refresh your browser, and select 2005 only. The storm tracks should filter to show only those from that year:
Assignment
Make a web page, using CartoDB.js, that will load your hexagonal binned Syria violent event visualization, allowing you to switch between a view of all the data, and just events from the first quarter of 2013.