Getting started
In this session we will start working with data, calculating some basic aggregate statistics and examining distributions.
We will make some static and interactive charts using web apps, and finish with a quiz on some of the principles of data analysis and visualization convered in this morning’s session.
The data we will use
Download the data for this session from here, unzip the folder and place it on your desktop. It contains the following files:
Zipped folder containing the following files:
oil_production.csvData on oil production by world region from 2000 onwards, in thousands of barrels per day, from the U.S. Energy Information Administration.gdp_pc.csvWorld Bank data on Gross Domestic Product (GDP) per capita for nations and groups of nations, from 1990 onwards, in current international dollars, corrected for purchasing power in different territories.mlb_salaries_2015.csvSalaries of players in Major League Baseball at the start of the 2015 season, from the Lahman Baseball Database.disease_democ.csvData illustrating a controversial theory suggesting that the emergence of democratic political systems has depended largely on nations having low rates of infectious disease, from the Global Infectious Diseases and Epidemiology Network and Democratization: A Comparative Analysis of 170 Countries.food_stamps.csvPercentage of Americans participating in the federal Supplemental Nutrition Asssistance Program from 1969 onwards, from the U.S. Department of Agriculture, plus the percentage of Americans below the federal poverty level, from the U.S. Census Bureau.nations_2015.csvData from the World Bank Indicators portal, which is an incredibly rich resource. Contains the following fields:iso2ciso3cTwo- and Three-letter codes for each country, assigned by the International Organization for Standardization.countryCountry name.year2015 for this data.gdp_percapGross Domestic Product per capita in current international dollars, corrected for purchasing power in different territories.life_expectLife expectancy at birth, in years.populationEstimated total population at mid-year, including all residents apart from refugees.regionincomeWorld Bank regions and income groups, explained here.
These files are in CSV format, which stands for comma-separated values. These are plain text files, in which fields in the data are separated by commas, and each record is on a separate row. CSV is a common format for storing and exchanging data, and can be read by most data analysis and visualization software. Values that are intended to be treated as text, rather than numbers, are often enclosed in quote marks.
The folder also contains a template web page, test.html, for embedding graphics we make.
Reshape data from wide to long
For this task we will use Open Refine (formerly Google Refine). It can streamline many data processing and cleaning tasks.
When you launch Open Refine, it opens in your web browser. However, any data you load into the program will remain on your computer — it does not get posted online.
The opening screen should look like this:
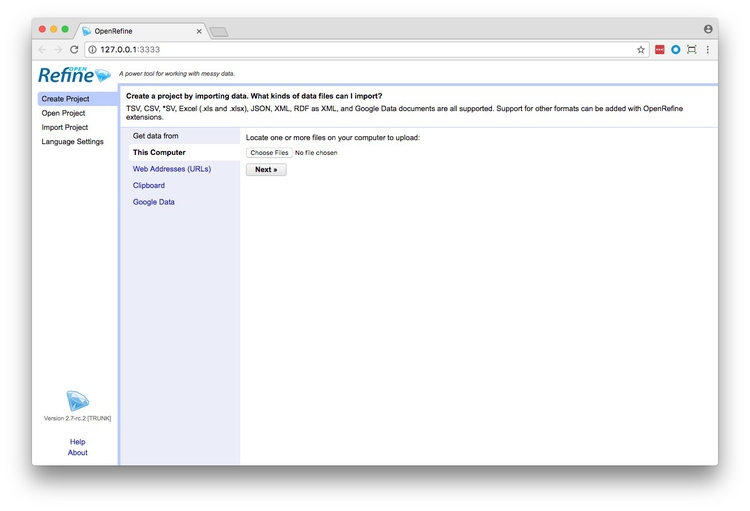
Click the Browse button and navigate to the file oil_production.csv. Click Next>>, and check that data looks correct:

Open Refine should recognize that the data is in a CSV file, but if not you can use the panel at bottom to specify the correct file type and format for the data. If your file has some initial header lines that need to be ignored, Open Refine can deal with that, too.
Make sure that the box marked Parse cell text into numbers, dates, ... is checked. Numbers and dates should appear in green, plain text in black. Also change the Project name to remove the csv.
When you are satisfied that the data has been read correctly, click the Create Project >> button at top right. The screen should now look like this:
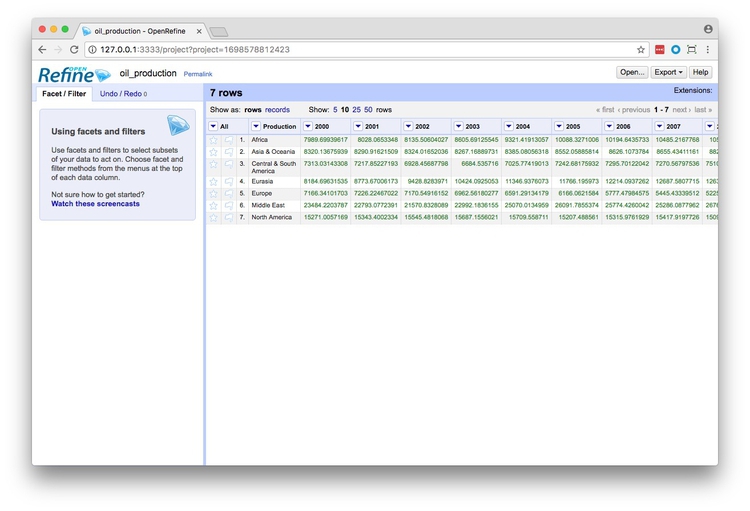
As you can see, the data is in wide format, with values for oil production by region organized in columns, one for each year. To convert this to long format, click on the small downward-pointing triangle for the first of these year columns, and select Transpose>Transpose cells across columns into rows.
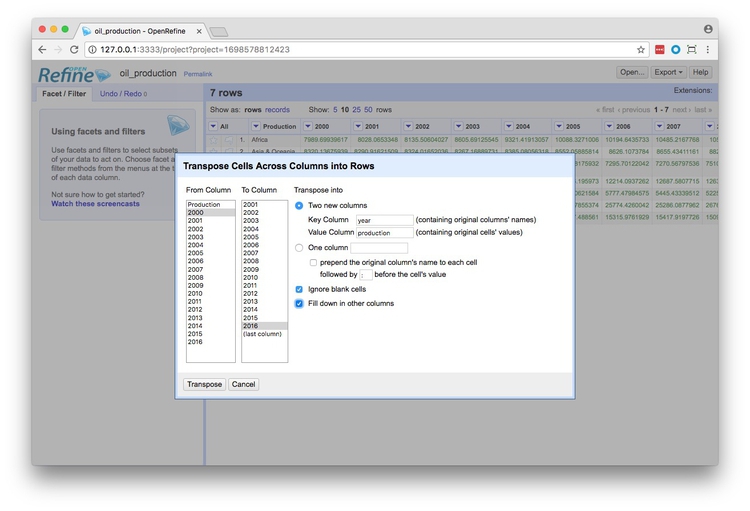
Fill in the dialog box as below, making sure that From Column and To Column are highlighted correctly, that the Key column and Value column have been given appropriate names, and that Fill down in other columns is checked. (Failing to do check this box will mean that the region names each will only appear once in the reshaped data, rather than being copied down to appear next to the corresponding data for year and oil production.)
Click Transpose and then the 50 rows link, to see the first 50 rows of the reshaped data:

Click the Export button at top right and you will see options to export the data in a variety of file types, including Comma-separated value and Excel spreadsheet.
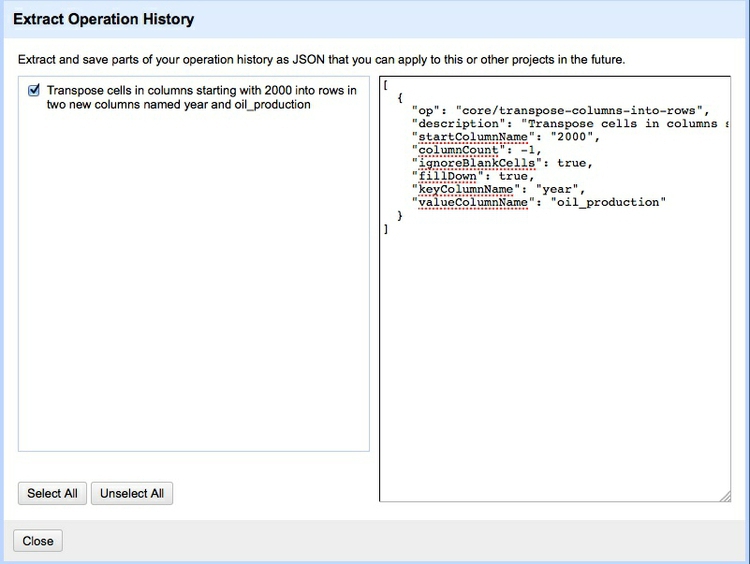
One particularly nice attribute of Open Refine is that you can save a script that will allow you to repeat the same processing on future iterations of the same data. To access this, select the Undo/Redo tab at top left and click Extract. The right-hand panel contains data in JSON (JavaScript Object Notation) format that describes the operations we just ran on the data. Copy this, paste into a blank text file and save.
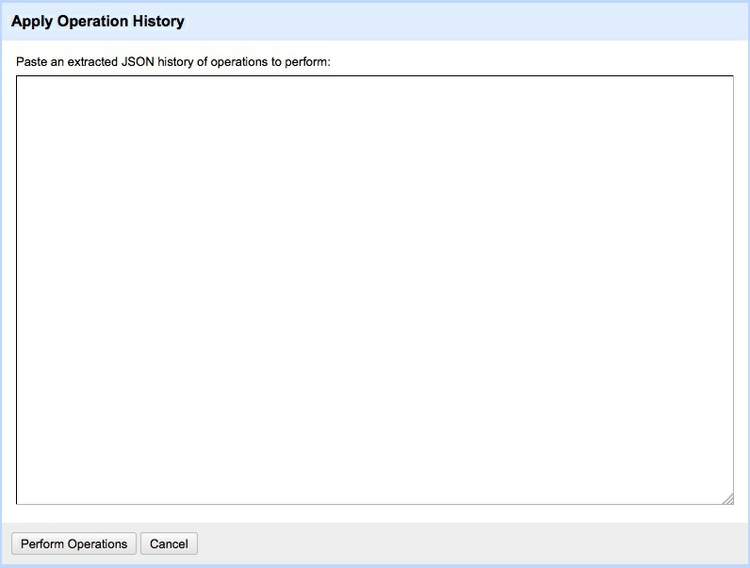
When you have an updated version of the oil production data, you can import it into Open Refine, and then click Apply ... in the Undo/Redo tab. Paste the JSON into the panel that appears and click Perform Operations:
For this simple operation, little time is saved, but for data that requires extensive processing, this is an extremely useful feature. Saving your processing scripts from Open Refine also means that your work is documented and reproducible, which is good practice.
Open Refine is a very powerful tool for data processing and cleaning that will reward efforts to explore its wide range of its functions — see the further reading/viewing, below.
More practice
Using Open Refine, convert the file gdp_pc.csv from wide to long format, and export it as a CSV file.
Calculate mean, median, mode and quantiles
We discussed these basic aggregate statistics, and why they are useful for storytelling with data, in this morning’s session. They can be calculated easily in a spreadsheet.
Navigate in your browser to your Google Drive account, then click the red NEW button at top left and select File upload. Navigate to the file mlb_salaries_2015.csv and click Open.
When the file has uploaded, click on its icon in the main panel of your Google Drive, then select Open>Google Sheets.
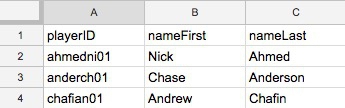
When the data has uploaded, drag the darker gray line at the bottom of the light gray cell at top left below row 1, so that the first row becomes a header.
Before:
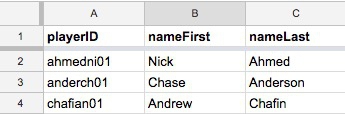
After:
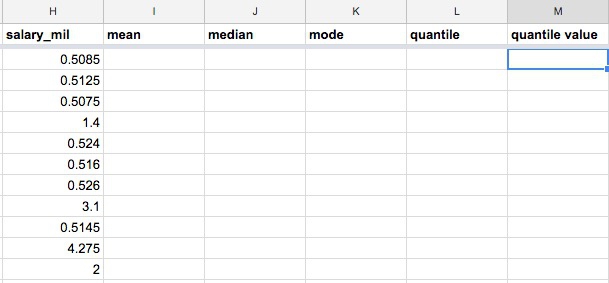
Select column H by clicking its gray header containing the letter, then from the top menu select Insert 1 right five times to insert five new columns into the spreadsheet. Give them the following headers:
In the first cell of the mean column enter the following formula, which calculates the mean (called average in a spreadsheet) of all of the values in column H, containing the salaries in $ millions for each player.
=average(H:H)
Now calculate the median salary:
=median(H:H)
And the mode:
=mode(H:H)
Next we will calculate the boundaries for bins dividing the data into five quantiles, with one-fifth (0.2 in decimal) of the values in each bin.
First enter the following values into the quantile column, to reflect the division into five quantiles:
=4/5
=3/5
=2/5
=1/5
Then enter this formula into the first cell of the quantile value column:
=percentile(H:H, L2)
Copy the formula down the top four rows, and the spreadsheet should look as follows:
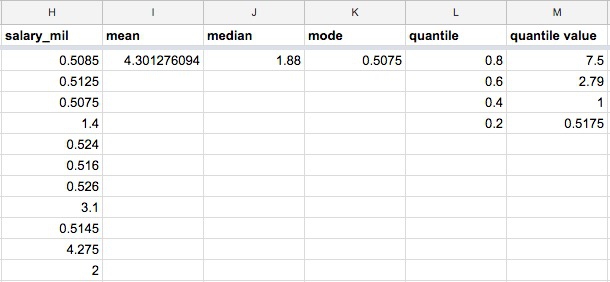
If we wanted to divide the players into five bins by their salaries, these numbers would represent the breaks between the bins.
More practice
Upload the file nations_2015.csv to your Google Drive account, open as a spreadsheet and calculate the mean and median GDP per capita for the world’s nations in 2015. Why did I not ask you to calculate a mode for this dataset?
Also, calculate the values of the breaks to divide the countries into five quantiles on the basis of their GDP per capita.
Examine distributions of data
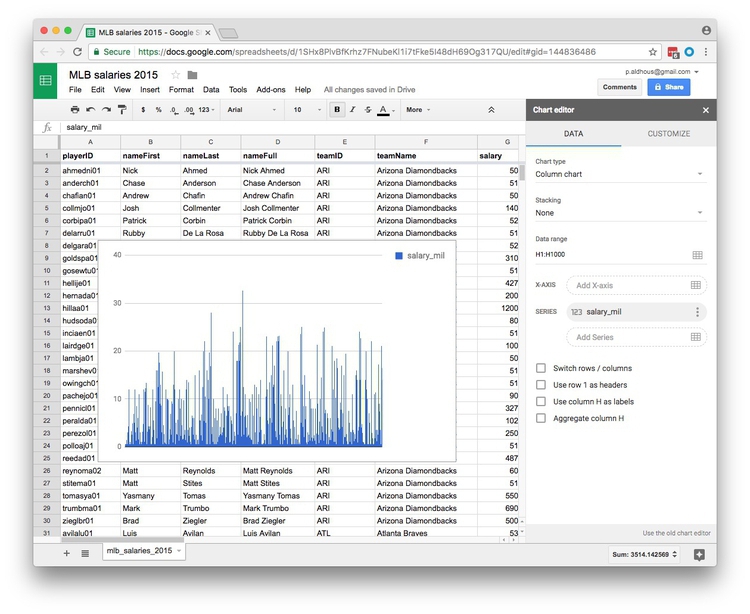
To quickly plot a histogram in Google Sheets, select the letter at the top to highlight the column for which you want to see the distribution (here H for salary_mil). Then select Insert>Chart from the top menu.
The default chart should look like this:
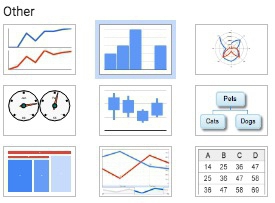
Now change the Chart type to Histogram chart you will need to scroll down to find this option, highlighted here:
Once selected, the chart should look like this:

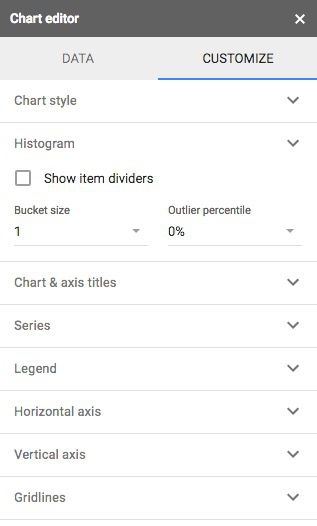
You can also CUSTOMIZE the chart by selecting a different increment, or bin width, for the columsn:
Make some simple interactive charts with Datawrapper
We will next explore the possibilities offered by Datawrapper, a web app developed by German journalism organizations that has been used to make simple interactive charts by several leading news outlets.
Datawrapper is unusual in that it works with data in “wide” format. If you want to make a line chart showing data for the same variable for a series of different categorical variables (cities, countries etc), for example, you will need the data for each city or country in a different column.
Navigate to Datawrapper and Login using the link at top right. Then click + New chart. At the next screen, click the ..or upload a CSV file button at bottom center:

Navigate to the file food_stamps.csv and Open. At the next screen you have options to edit column headings.
You can also select each of the columns by clicking on their letters, to set the data type or customize the number format. These options can be useful — for instance to format data as currency or to convert large numbers entered in full into thousands or millions. You can also choose to hide certain columns from the visualization. In this case, we will Append a % symbol to the Percent in poverty and Percent on food stamps columns:

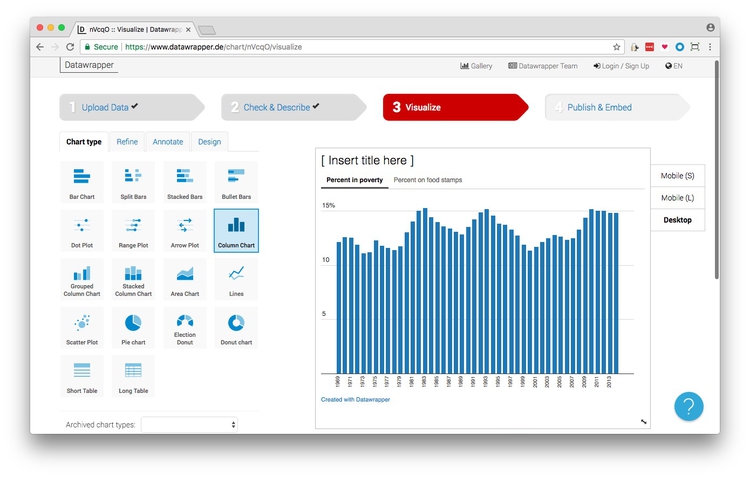
Click the blue Proceed > button to move to the visualization screen. The default option is a bar chart. Switch to a Column Chart, which would make more sense for this time-series data. Notice that it can switch interactively between displaying the poverty and food stamps data, You may also need to use the Resize to: options beneath the chart for the chart to fit on your screen. Here I have set the width to 600 pixels and the height to 500 pixels:
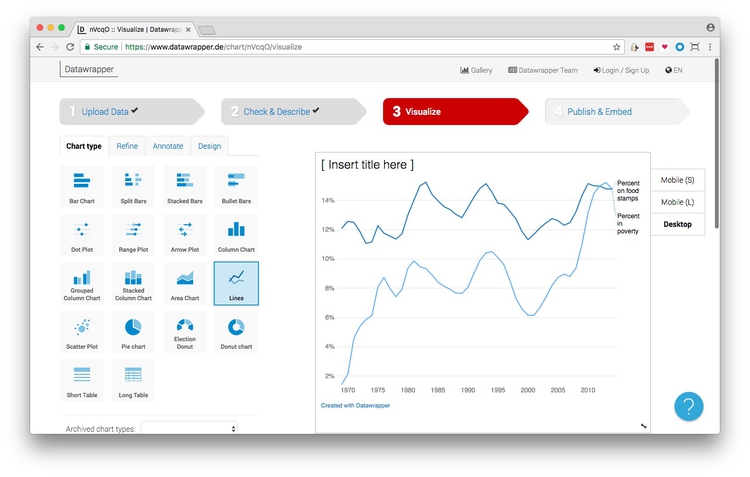
However, we want to draw a line chart showing the percentage of Americans in poverty and on food stamps over time, so switch to Lines:
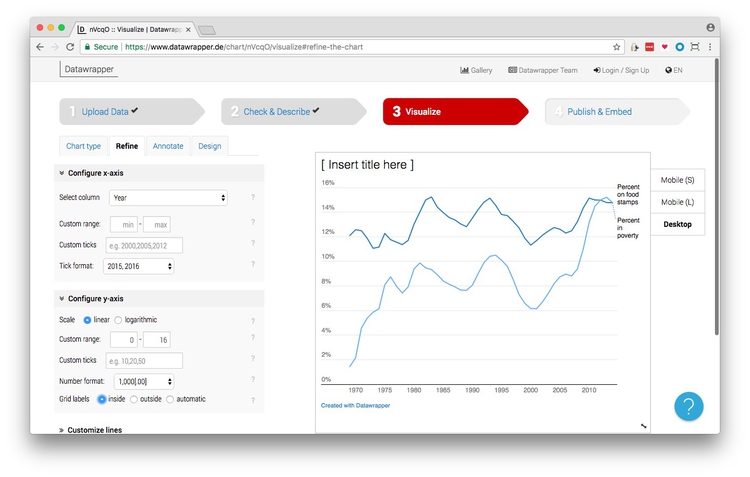
Now click on the Refine tab to start customizing the chart. The options for Configure x-axis and Configure y-axis allow you to set the range for the axes and positions of the ticks marks. You can also change number formats, and for continuous variables choose between a linear and logarithmic axis. For data recognized as dates, Tick format allows you to choose the formatting of the dates.
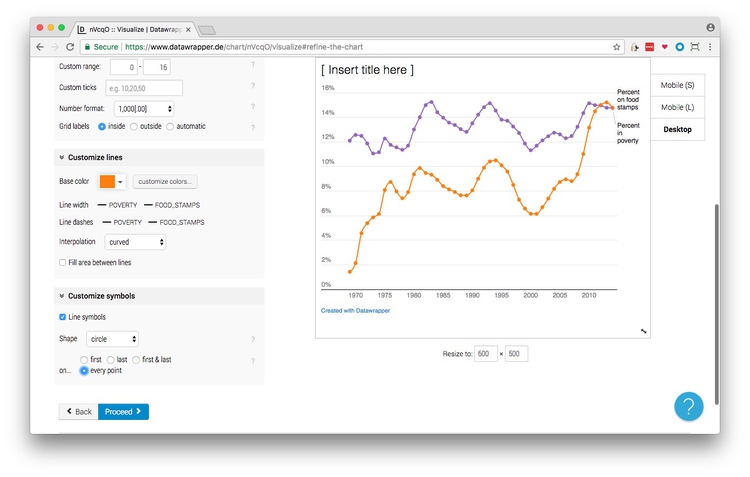
We will change the positioning of the Y axis Grid labels to inside, and set the Y axis range from 0 to 16:
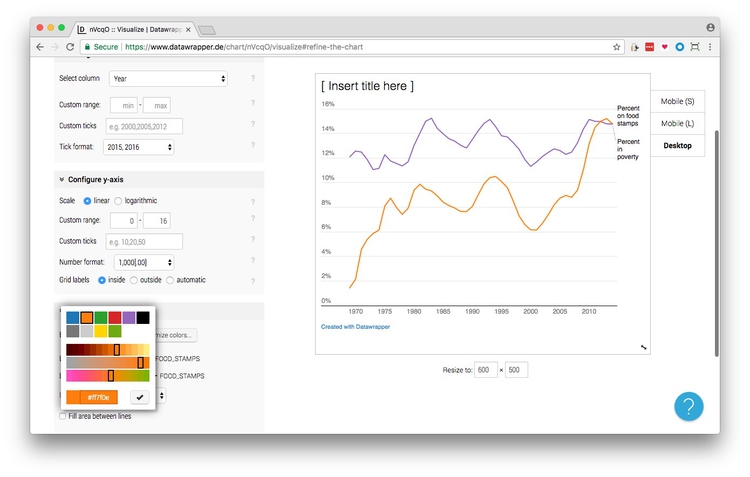
The Customize lines options allow you to change the color, thickness, and style of the lines. Click customize colors... and change the color of the two lines. You can select colors by pointing and clicking, or by typing their HEX values into the box at the bottom:
Clicking on Line width and Line dashes allows you to change their appearance. Increase the thickness of both lines.
Experiment with Interpolation to see how the different options affect the display. Consider which option is best based on the nature of your data, and what you are trying to show. In this case curved gives a more pleasing visual effect, and does not significantly alter the story told by the data. But if your data had pronounced peaks and troughs that would be altered by this interpolation, and these were important to your story, this would not be a good choice.
For a line chart, Customize symbols allows you to choose a dot-and-line chart. Check Line symbols and every point to see this option:
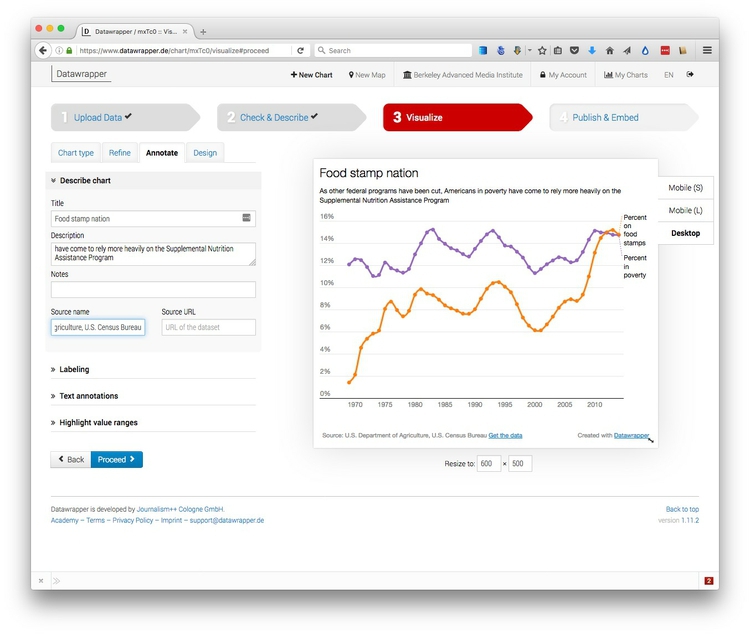
Click Proceed to move to the Annotate tab.
Under Describe chart, and a title, subtitle, and source information to the chart.
The Labeling options allow you to switch between directly labeling the lines, or a legend. Select top to display a legend.
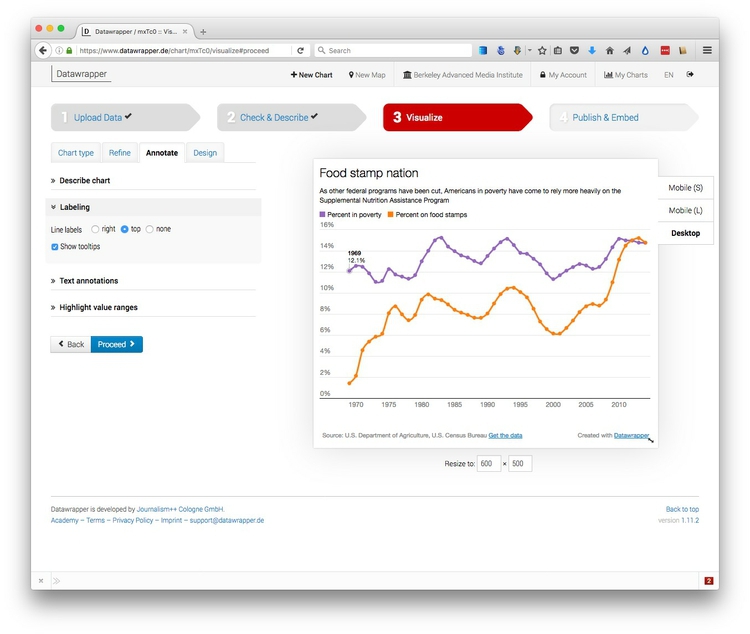
You can also opt to turn off the tooltips that appear when you hover over the data points.
You can add annotations to the chart using Text annotations, and add shaded bars to parts of the chart using Highlight value ranges.
Click Proceed to move to the Design tab. This gives you the option to Enable Social Sharing, which will add buttons to share via Facebook, LinkedIn and Twitter.
Click the blue Publish > button to move to the final screen, which contains options to publish the chart. With a free account, you will have the single option to Embed chart on website. Click the link and grab the embed code, under the Responsive Embed tab, which should look something like this.
<iframe id="datawrapper-chart-mxTc0" src="//datawrapper.dwcdn.net/mxTc0/1/" frameborder="0" allowtransparency="true" allowfullscreen="allowfullscreen" webkitallowfullscreen="webkitallowfullscreen" mozallowfullscreen="mozallowfullscreen" oallowfullscreen="oallowfullscreen" msallowfullscreen="msallowfullscreen" width="100%" height="500"></iframe><script type="text/javascript">"undefined"==typeof window.datawrapper&&(window.datawrapper={"mxTc0":{}}),window.datawrapper["mxTc0"].embedDeltas={"100":708,"200":551,"300":517,"400":500,"500":500,"600":500,"700":500,"800":483,"900":483,"1000":483},window.datawrapper["mxTc0"].iframe=document.getElementById("datawrapper-chart-mxTc0"),window.datawrapper["mxTc0"].iframe.style.height=window.datawrapper["mxTc0"].embedDeltas[Math.min(1e3,Math.max(100*Math.floor(window.datawrapper["mxTc0"].iframe.offsetWidth/100),100))]+"px",window.addEventListener("message",function(a){if("undefined"!=typeof a.data["datawrapper-height"])for(var b in a.data["datawrapper-height"])"mxTc0"==b&&(window.datawrapper["mxTc0"].iframe.style.height=a.data["datawrapper-height"][b]+"px")});</script>
Paste this code into the HTML of your web page and upload to the web to view your chart.
With a free account, you can publish charts, tables and maps with up to 10,000 views per month. If your website gets more traffic, you can explore the paid options here. Upgraded accounts also offer the options to Export as static image, which exports a file in PNG format, and Export chart as PDF.
More practice
Upload the file nations_2015.csv to Datawrapper and try to replicate the Gapminder chart for 2015, with GDP per capita on the X axis and life expectancy on the Y.
Take a quiz
Complete this quiz on principles of data analysis and visualizaton.