Introduction to Data Visualization: Student Projects
A compilation of projects completed by students in the Fall 2020 data visualization course at the UC Berkeley Graduate School of Journalism. Instructor: Peter Aldhous.
Sarah Bohannon
‘There Is No Fire Currently In Butte County’
Cal Fire’s words 90 minutes before residents warned To evacuate North Complex fire.
View ProjectChloe Reynolds

The History Of Video Games
A visual analysis of video game sales, by publisher and platform.
View ProjectYuri Avila
Abortion clinics in Mexico City
A tool that women can use if they decide to have an abortion in Mexico City.
View ProjectYinuo Shi and Brett Marsh
Mass Transit Changes Under COVID-19 in the East Bay
AC Transit bus routes were cut during the pandemic. These maps show the affected neighborhoods, in relation to vehicle access and median household income.
View ProjectCoral del Mar Murphy-Marcos
Ying Zhao
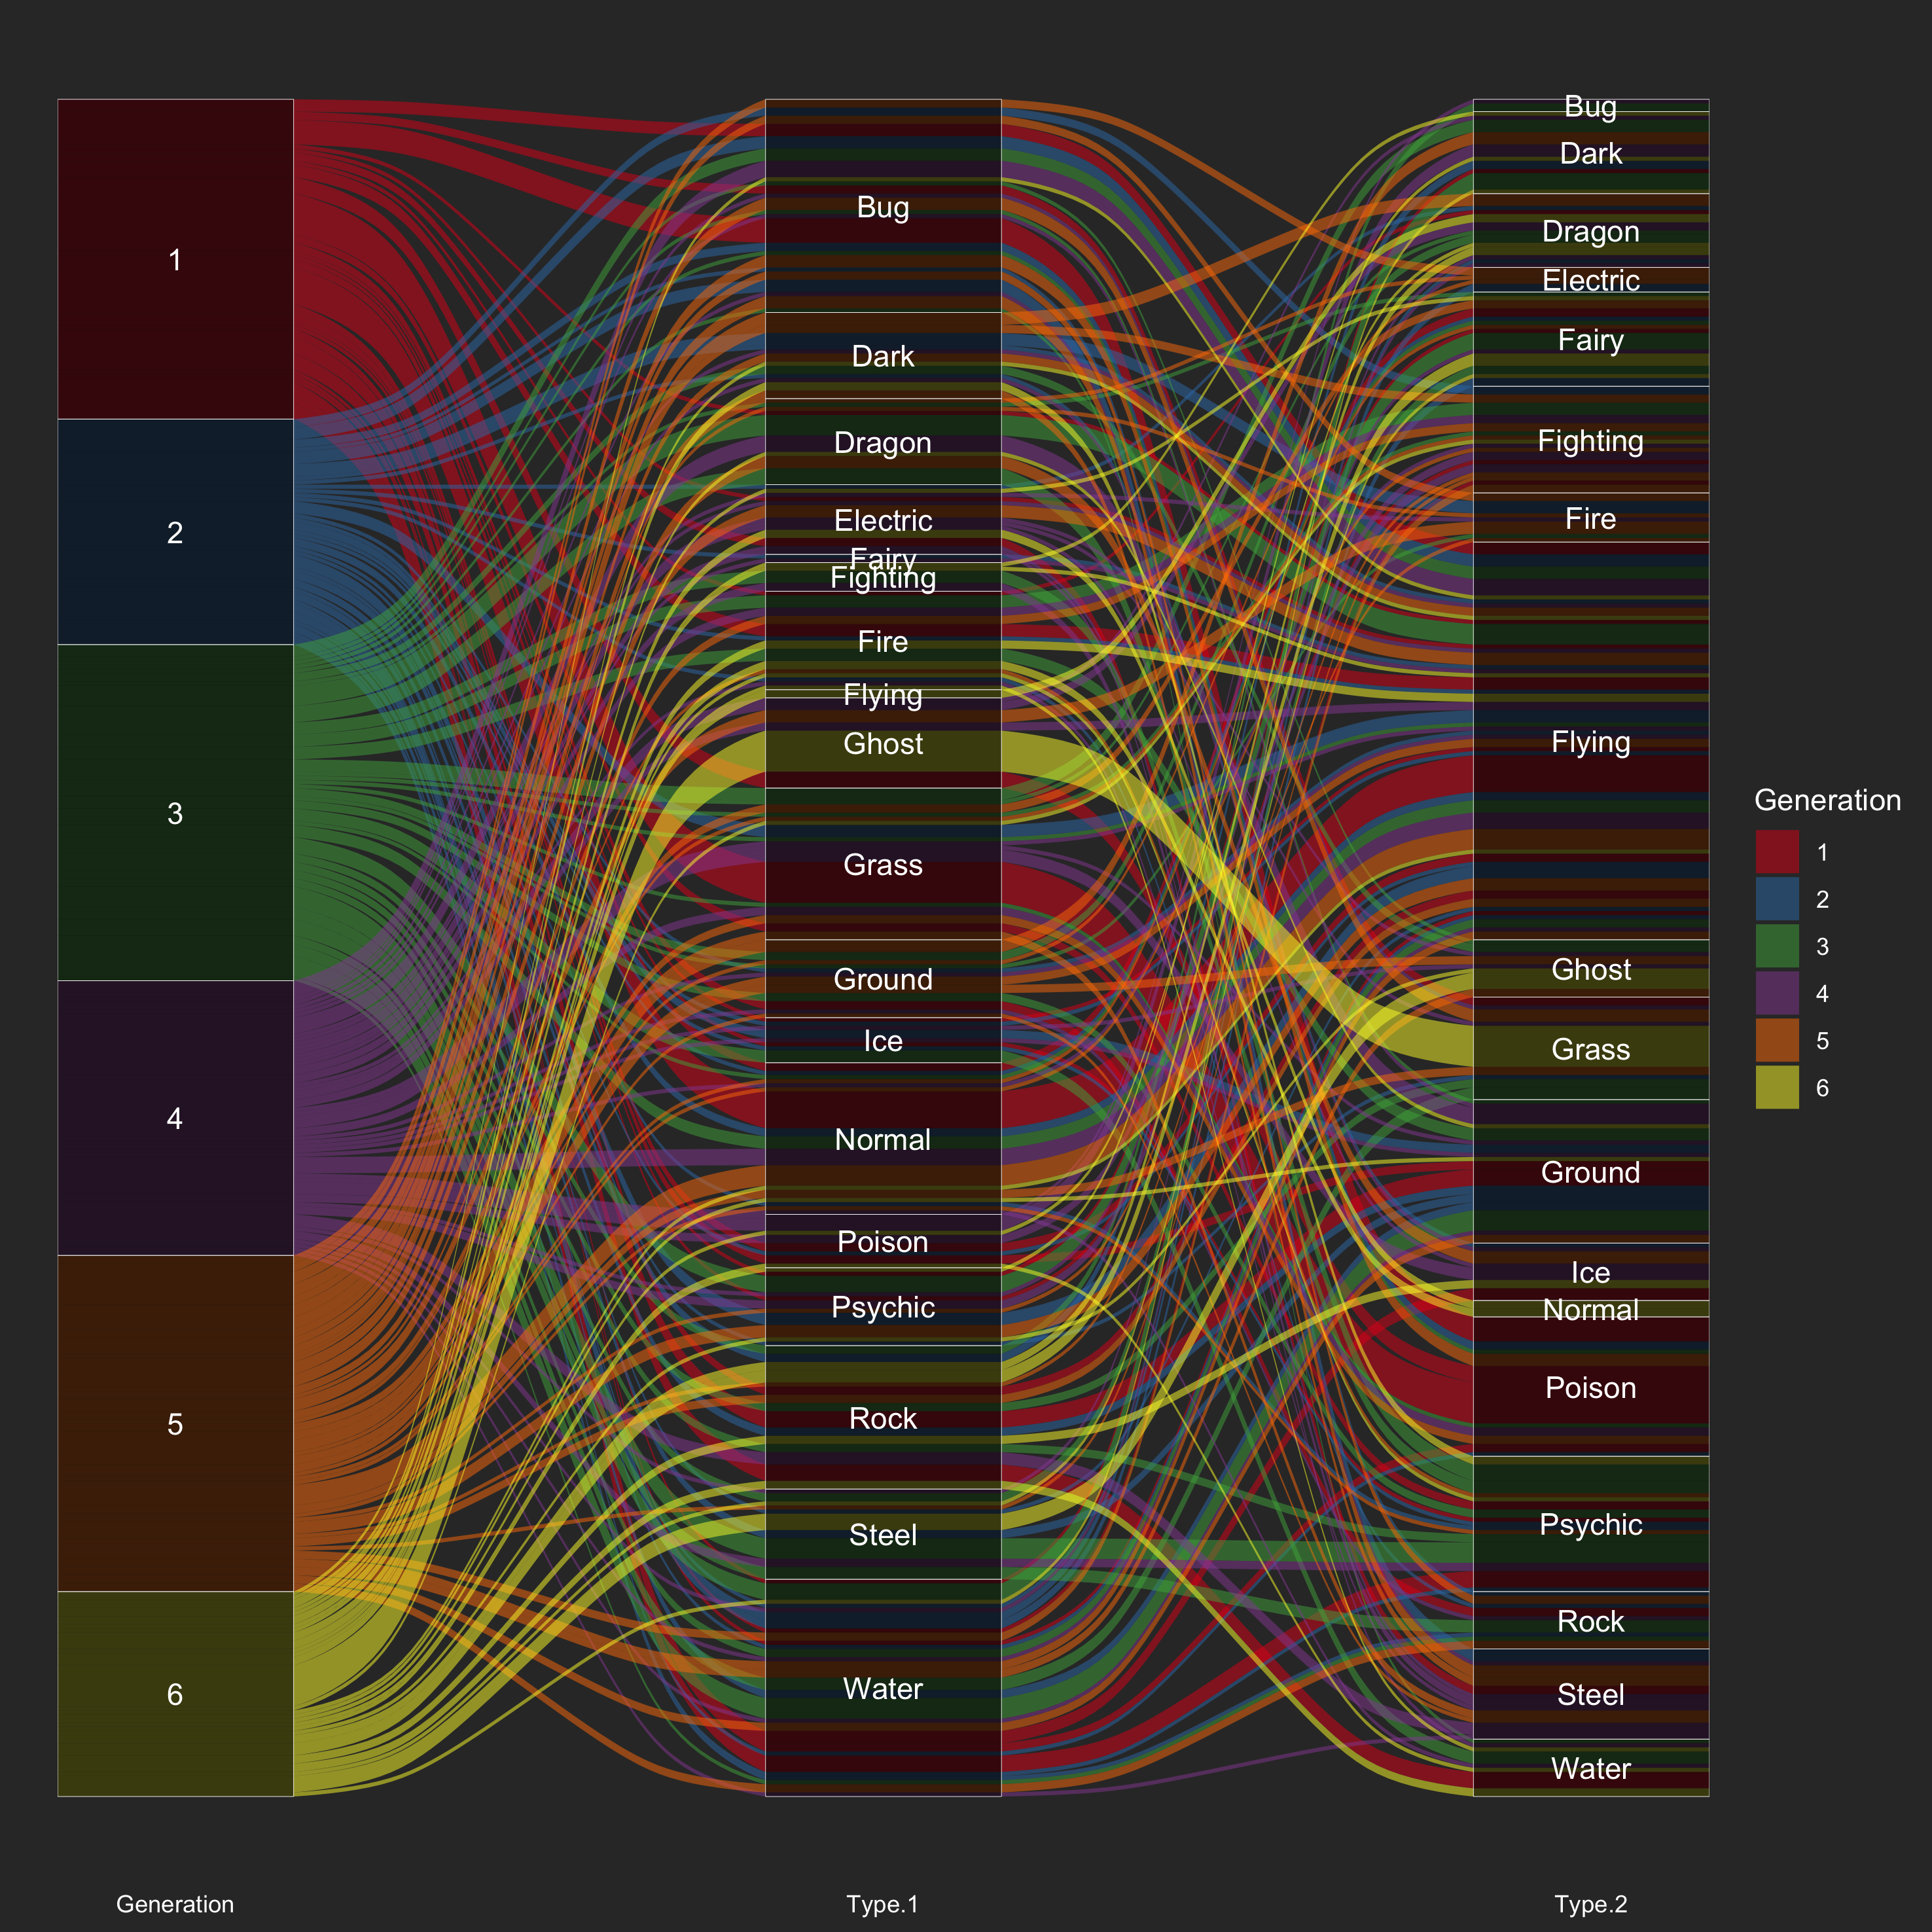
Pokémon Demography
There are 800 Pokémon inhabiting in the Pokémon universe, waiting for the right trainer to catch, train, and love them.
View ProjectVictoria Dmitrieva
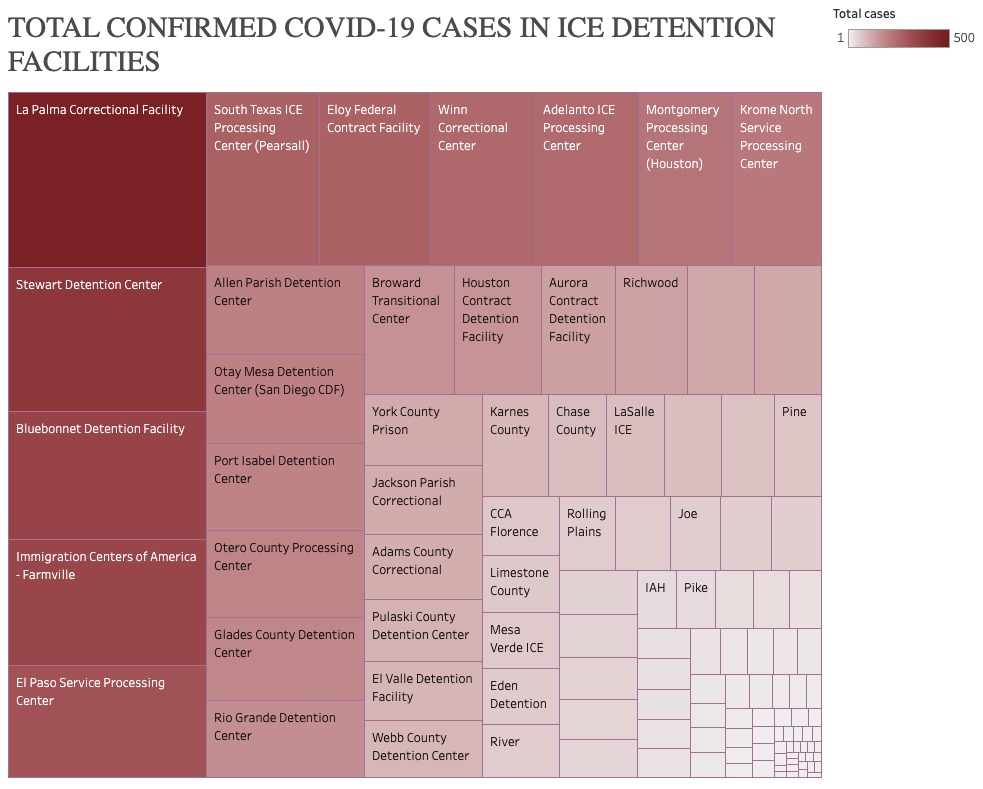
COVID-19 cases in ICE Detention Centers in the US
Multiple ICE detainees are testing positive in ICE facilities across the country in unsanitary and overcrowded conditions.
View ProjectEliza Partika
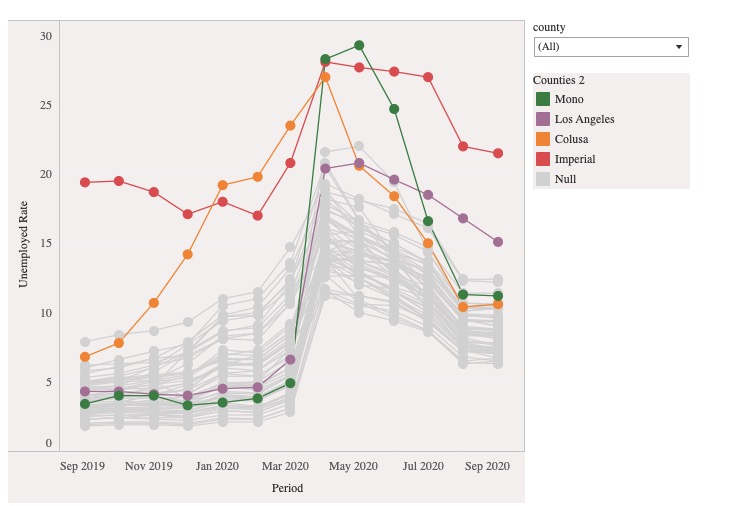
Unemployment in California in the Pandemic
California's unemployment rates changed drastically for some counties after the pandemic hit. See how it's changed since 2019.
View ProjectSteph Penn
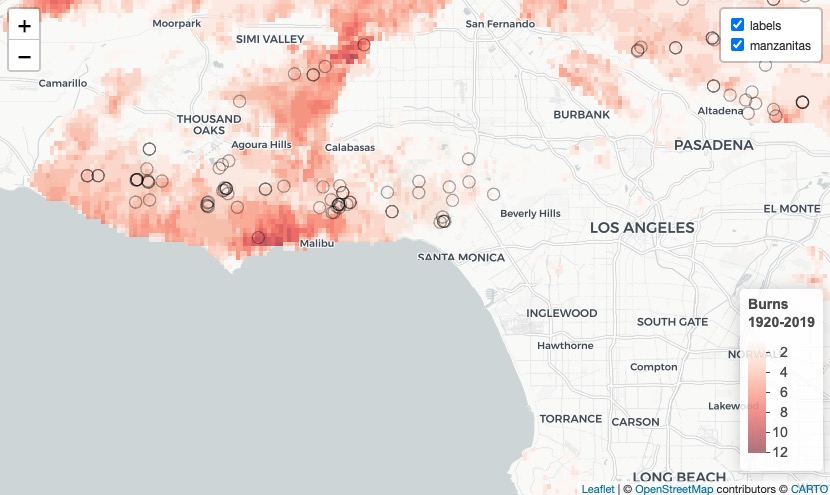
Rare Manzanitas and Wildfires
The map shows confirmed locations of rare Manzanitas in a relation to burn frequencies over the last century.
View ProjectLaurine Lassalle
How Popular Are Low Emission Vehicles in California?
California is ready to ban gasoline-powered cars by 2035.
View ProjectPeiyun Jiang
Deena Sabry
Female Employment Around The World
Over the past three decades, the number of female wage and salaried workers has significantly increased across the world.
View Project