Introduction to Data Visualization: Student Projects
A compilation of final projects completed by students in the Fall 2016 data visualization course at the UC Berkeley Graduate School of Journalism. Instructor: Peter Aldhous; thanks also to J-School lecturer Jeremy Rue for help and advice to students.
Lucas Waldron
A Town Divided
Patagonia, Arizona, is a town divided by the mining industry. These visualizations contextualize the conflict in the town by highlighting economic, environmental, and historical trends in Patagonia, Santa Cruz County, and across Arizona.
View ProjectPaayal Zaveri
Christian Stork
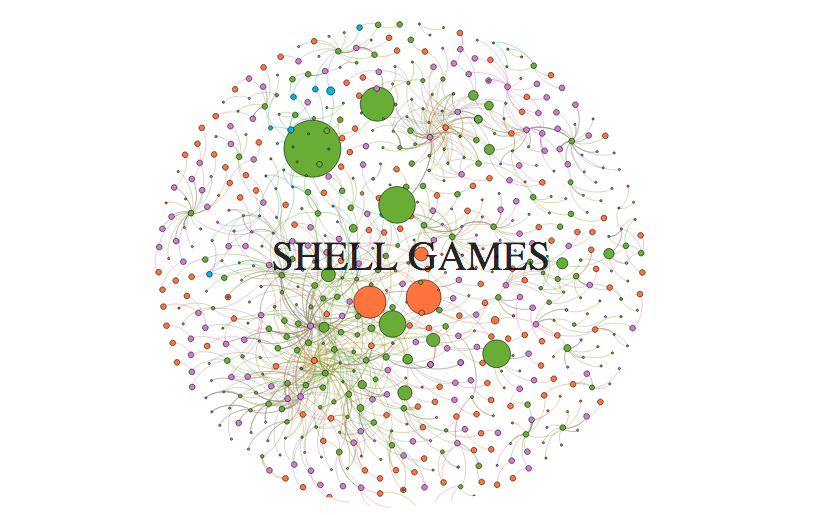
Shell Games
This project looks at a network of companies, their assets, and directors. It is part of an ongoing investigation into foreign organized crime and money laundering activities in the U.S.
View ProjectGraelyn Brashear
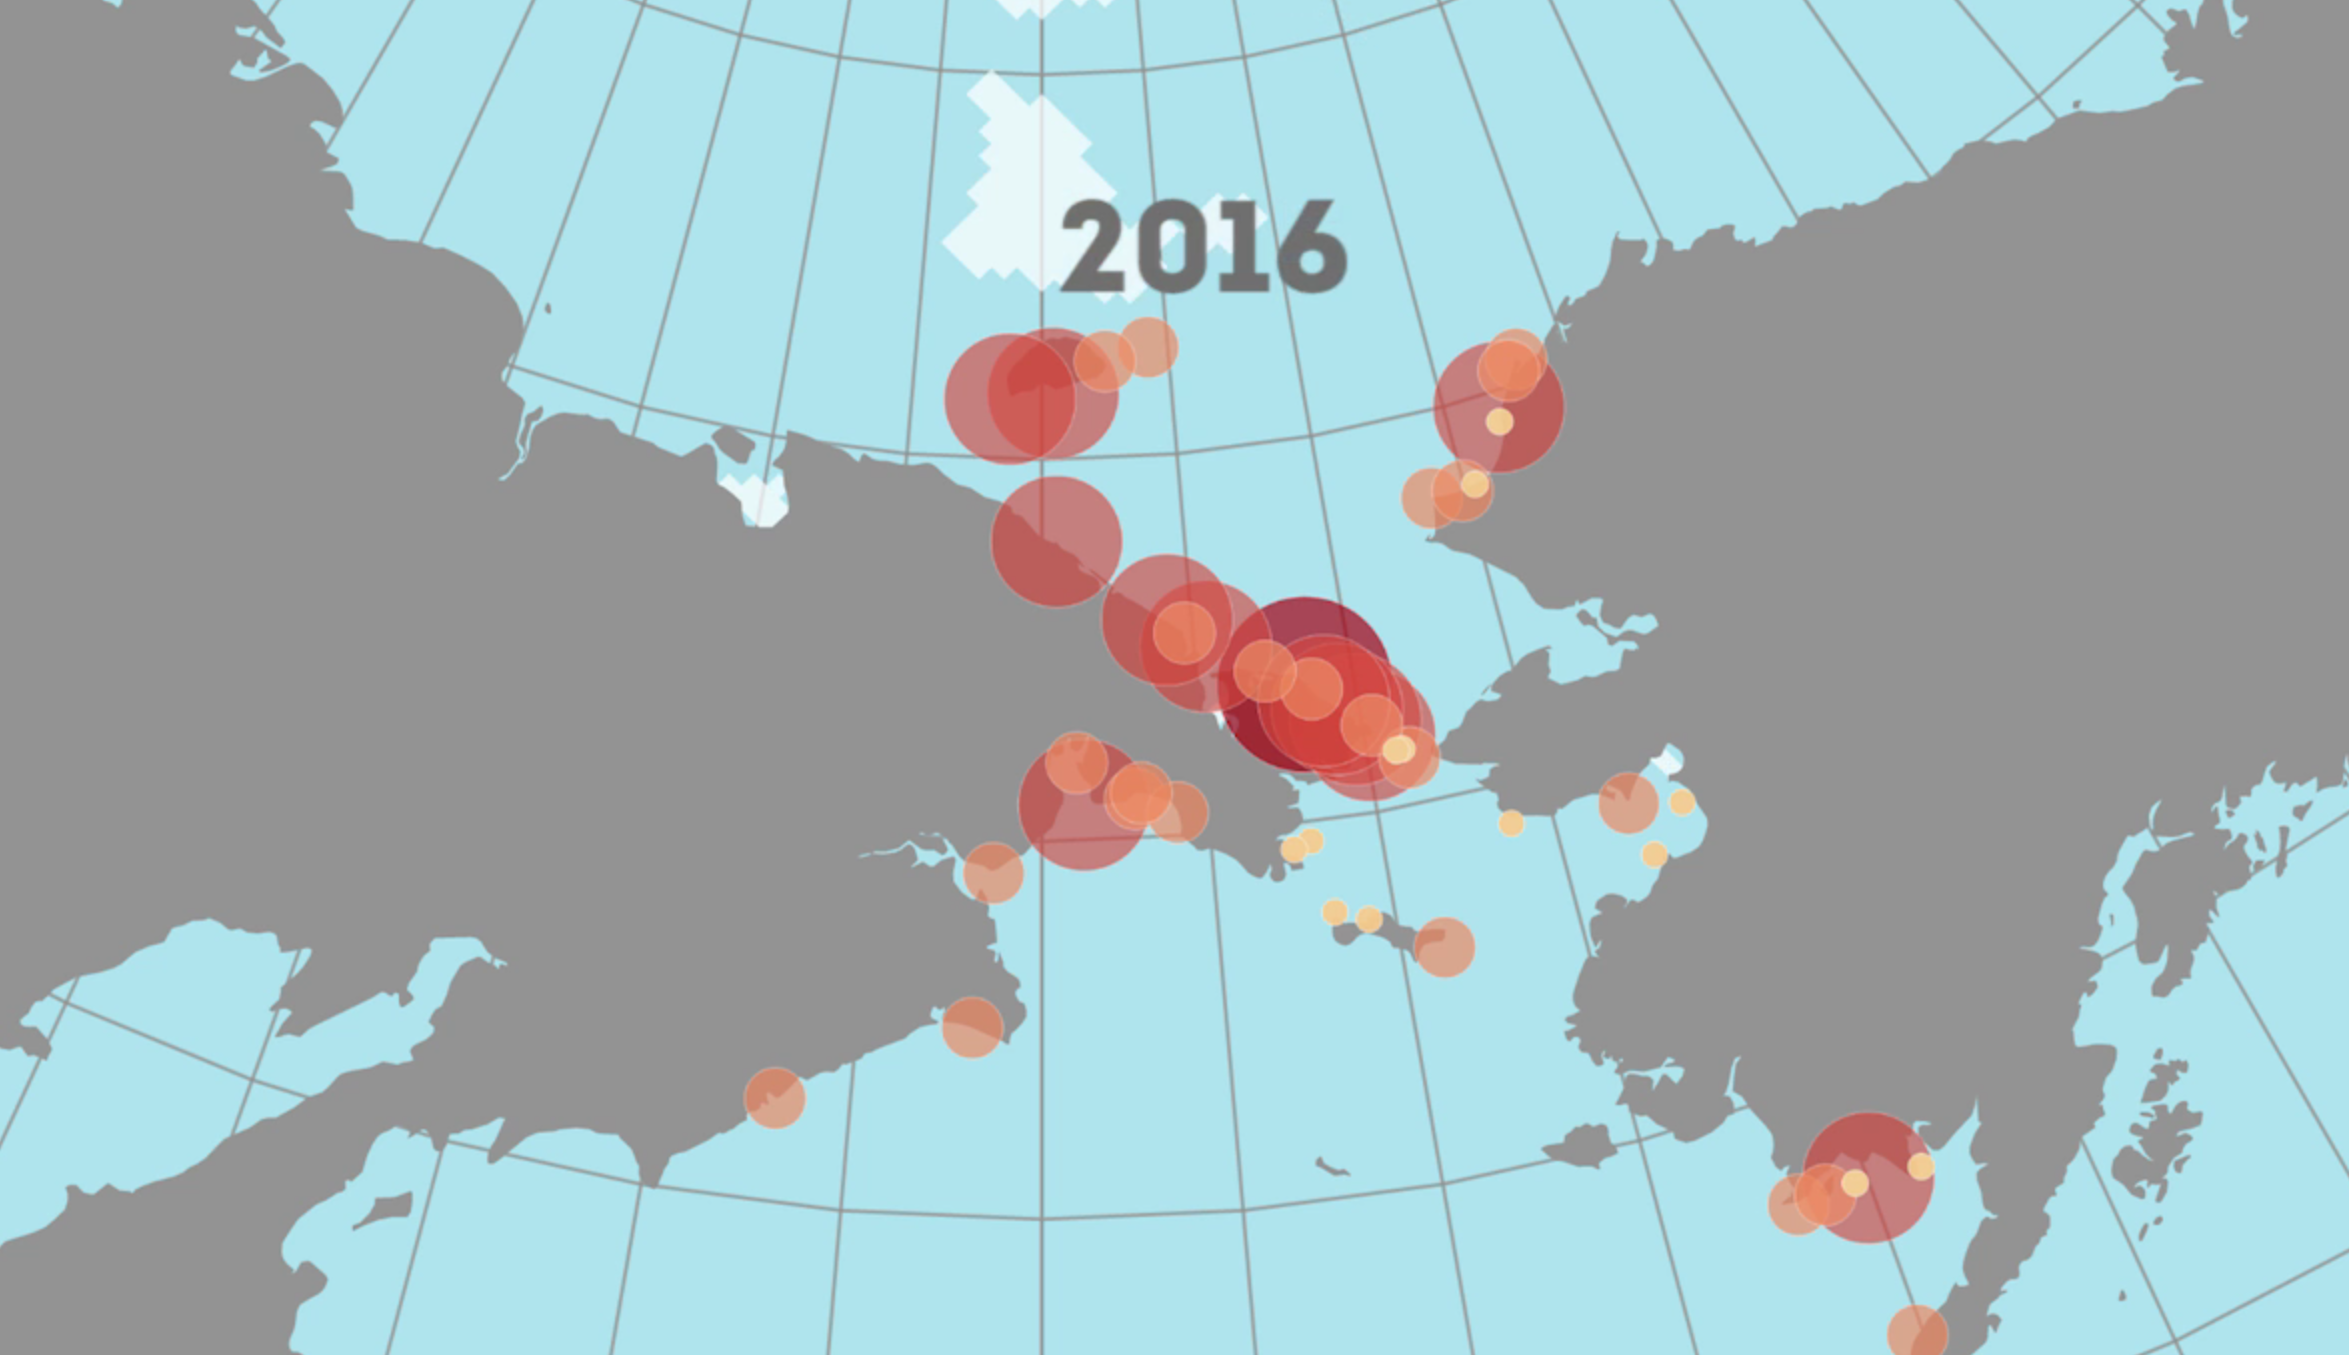
Sea Change
As summer sea ice vanishes in the Arctic, the Pacific walrus faces an uncertain future.
View ProjectIke Smith
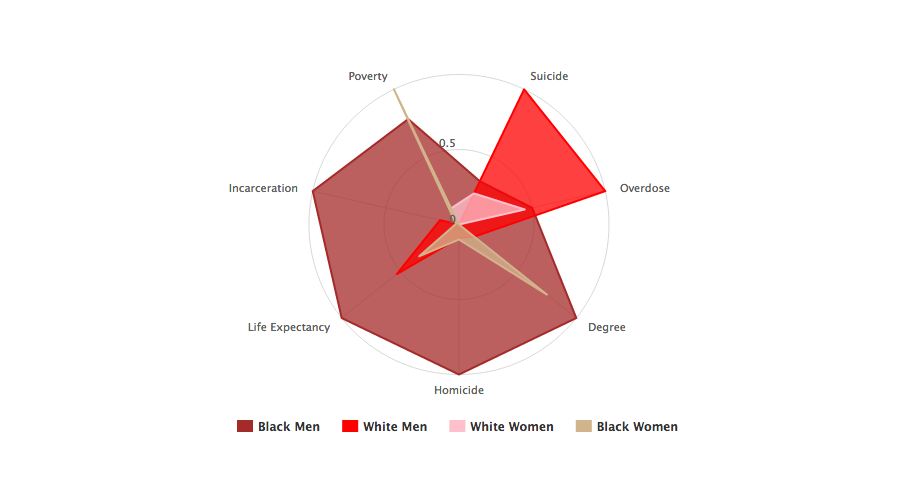
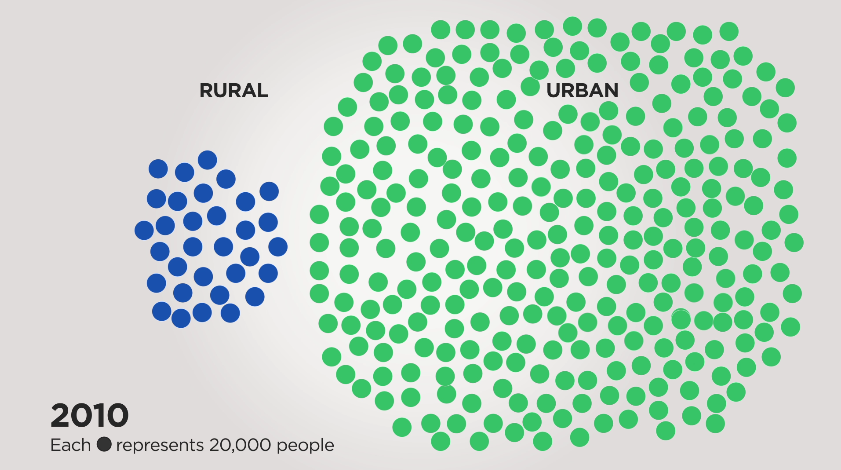
An Atlas of Suffering
This project visualizes some important aspects of inequality in America, by race and gender.
View ProjectBrian Rinker
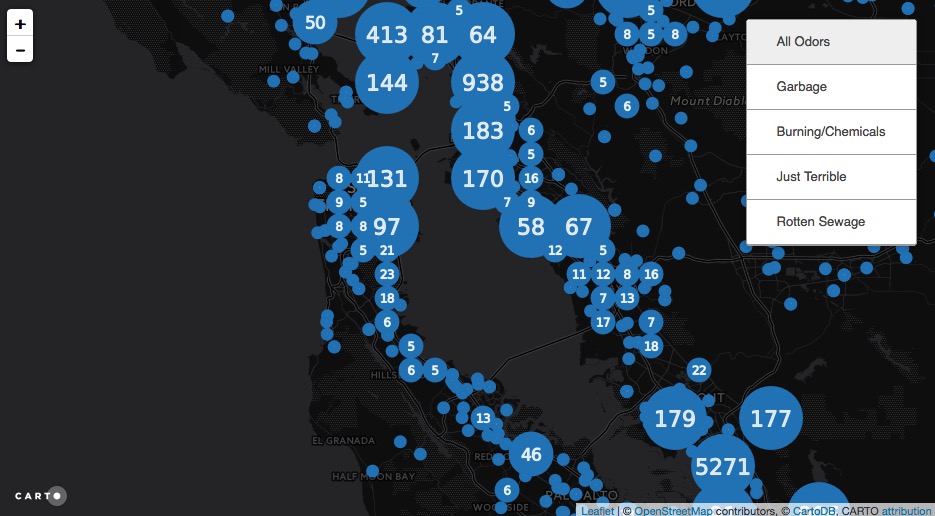
The Stenches of the Bay Area
The Bay Area has a lot of stinky smells and places. The most malodorous are reported to the Bay Area Air Quality Management District.
View ProjectSam-Omar Hall
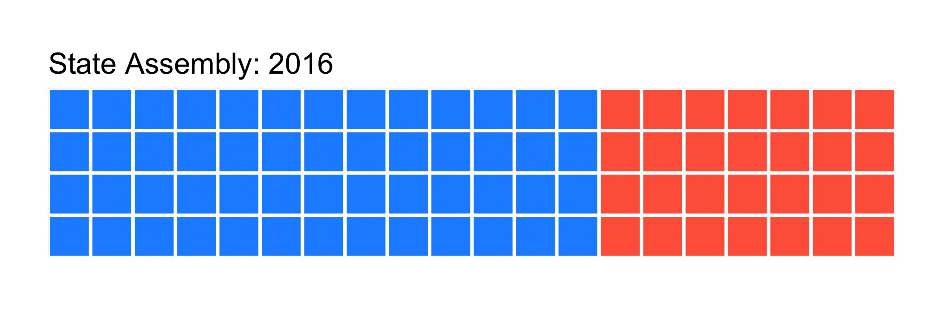
In California, Dems Often Battle Dems
In recent decades, the California state legislature has been increasingly dominated by Democrats. Changes to the primary election system mean that Democrats may now battle in the primary and then again in the general election.
View ProjectSabhanaz Rashid Diya
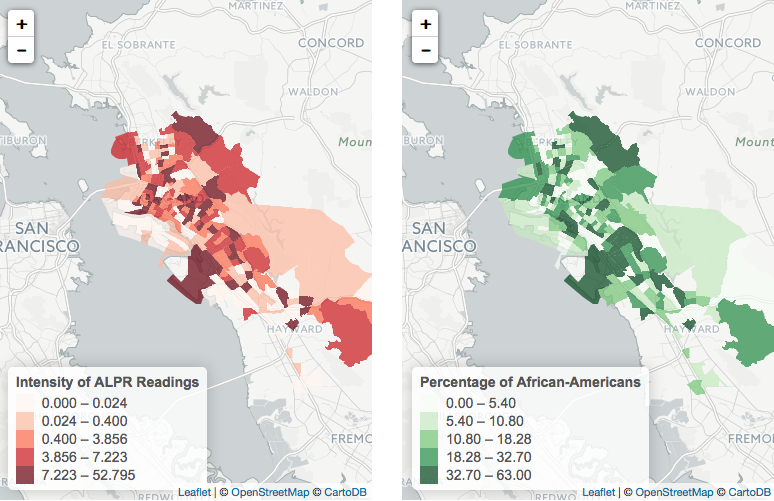
How Oakland Police Are Collecting Your Sensitive Location Data
A visual analysis of automatic license plate reader data.
View ProjectMariela Patron
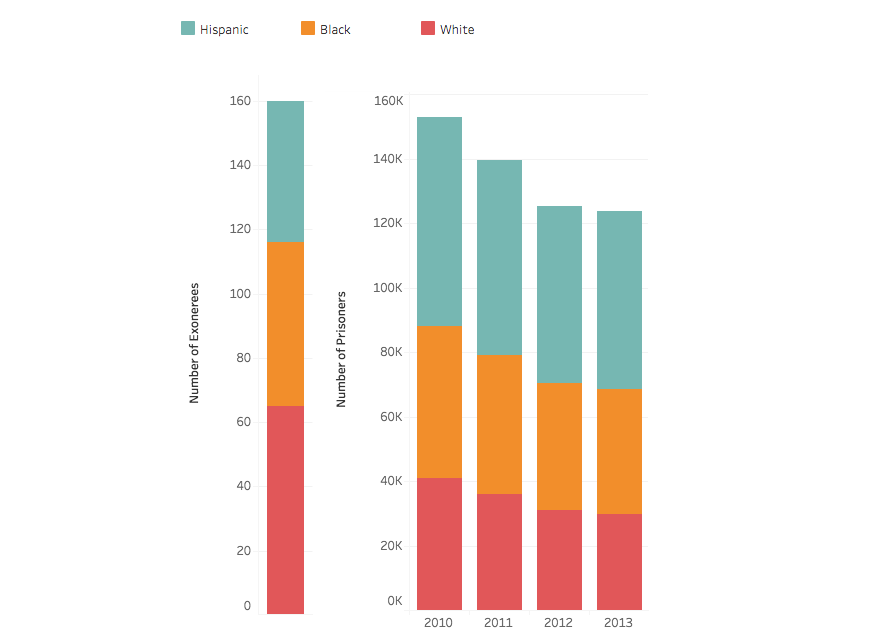
The Exonerated
Data visualizations from a larger project that profiles people who were wrongfully convicted in California and applied for compensation.
View Project