Introduction to Data Visualization: Student Projects
A compilation of final projects completed by students in the Fall 2015 data visualization course at the UC Berkeley Graduate School of Journalism. Instructor: Peter Aldhous; thanks also to J-School lecturer Jeremy Rue for help and advice to students.
These projects were completed shortly before the J-School lost a giant, Paul ‘Grabs’ Grabowicz, director of the New Media Program, of which this course is a part. RIP Grabs; we are grateful for your vision and inspiration.
Jieqian Zhang
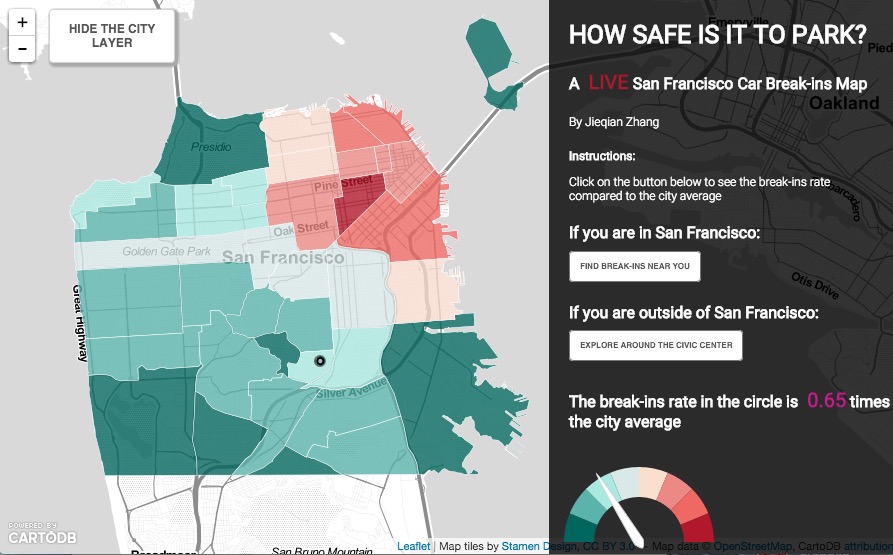
How Safe Is It To Park?
A live San Francisco car break-ins map, showing data from the most recent 12 months.
Also see this graphic to find out when the risk is highest.
Source: SF Open Data.
View ProjectBrett Murphy
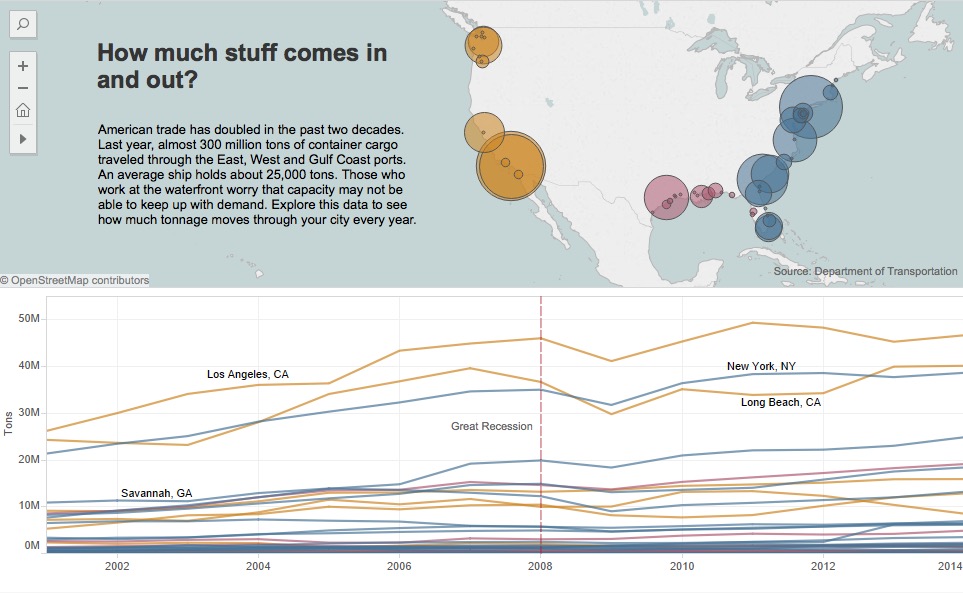
The Container Economy
American trade has doubled in the past two decades. Explore this data to see how much tonnage has moved through U.S. ports.
Source: Department of Transportation.
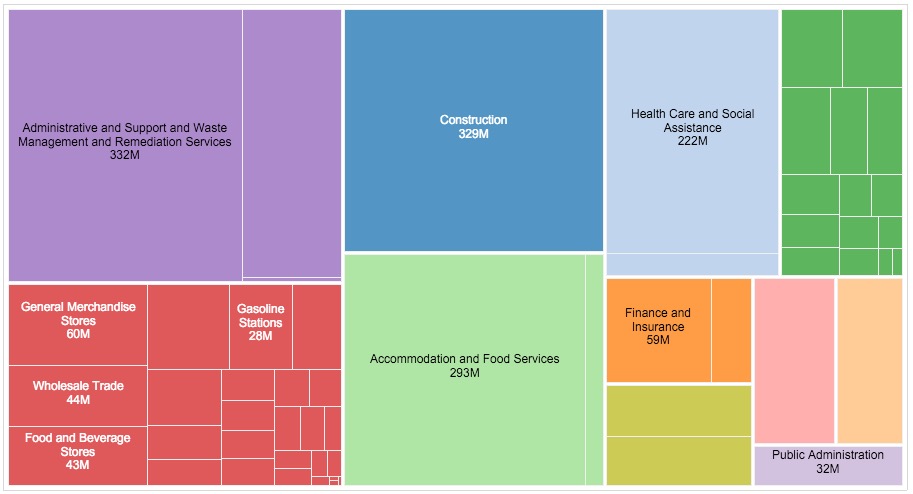
View ProjectHow Companies Keep Billions From Their Employees
The Department of Labor investigates thousands of companies every year, based on its own suspicions or after an employee files a complaint, and has compiled every case it has opened in each of 11 "super sectors" since 2007 — some findings go back decades. Most cases involve Fair Labor Standards Act violations, like skirting minimum wage laws or unpaid overtime.
Source: Department of Labor.
View ProjectJeremy Lin
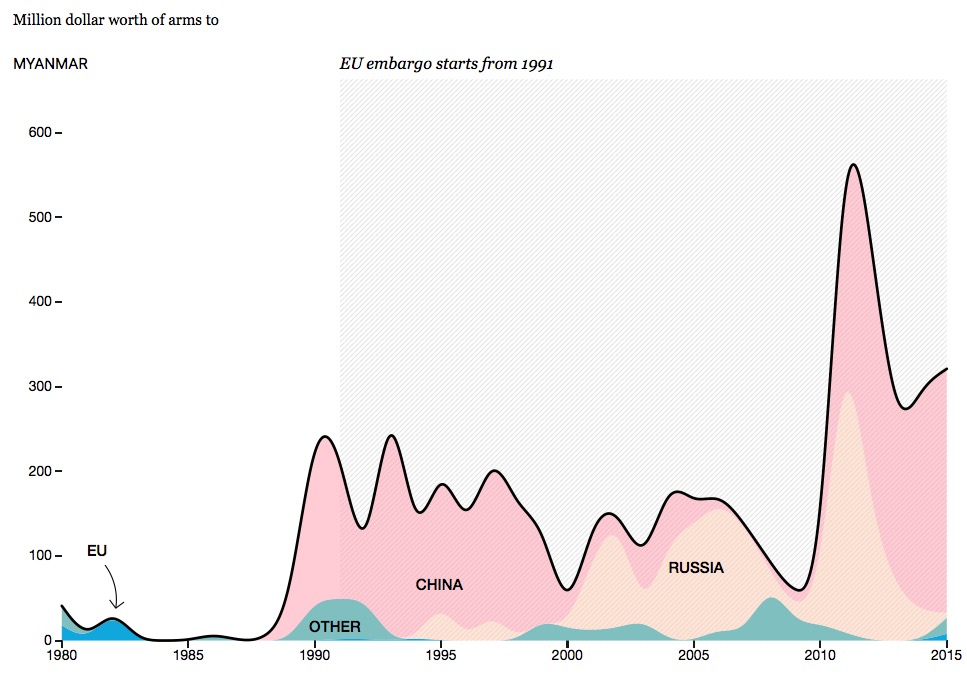
Do Arms Embargoes Actually Work?
A closer look at the impact of international embargoes on arms imports by China, Myanmar, North Korea, and Syria.
Source: Stockholm International Peace Research Institute.
View ProjectTed Andersen
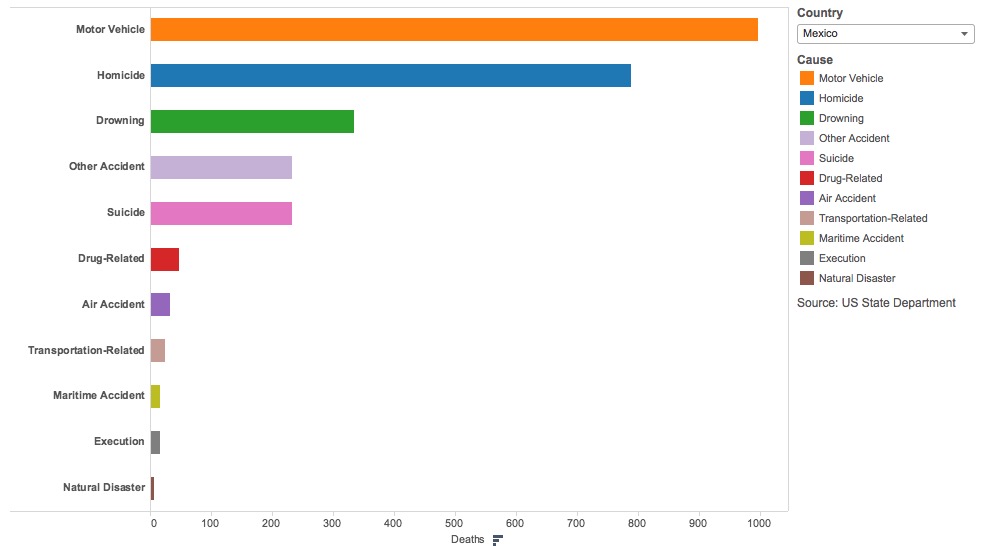
American Deaths Abroad
Since 2003, the U.S. State Department has kept complete annual records of where and how American citizens die non-natural deaths in foreign countries. Where and how do they die?
Sources: State Department, Office of Travel & Tourism Industries, Tourism Authority of Thailand.
View ProjectLarry Zhou
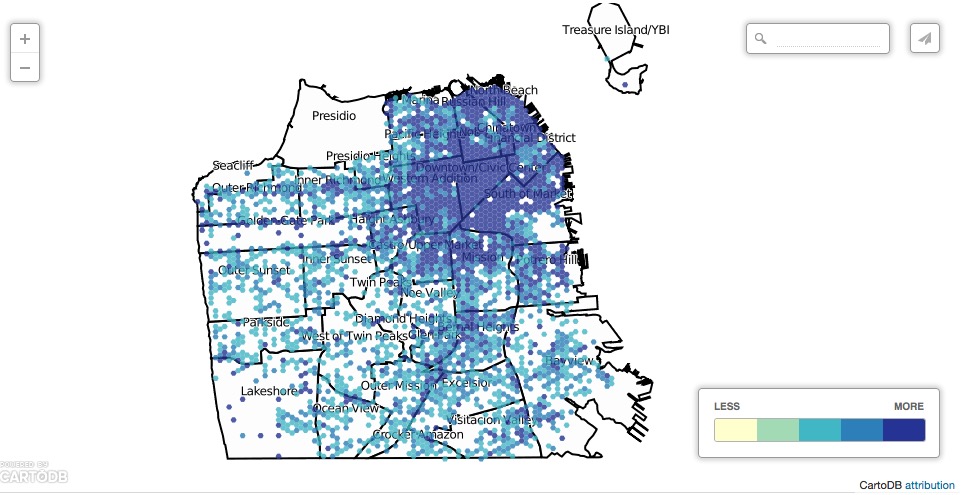
San Francisco Car Burglary
The city has experienced a wave of car crime over the past few years. Which neighborhoods have been worst affected?
Source: SF Open Data.
View ProjectFan Fei
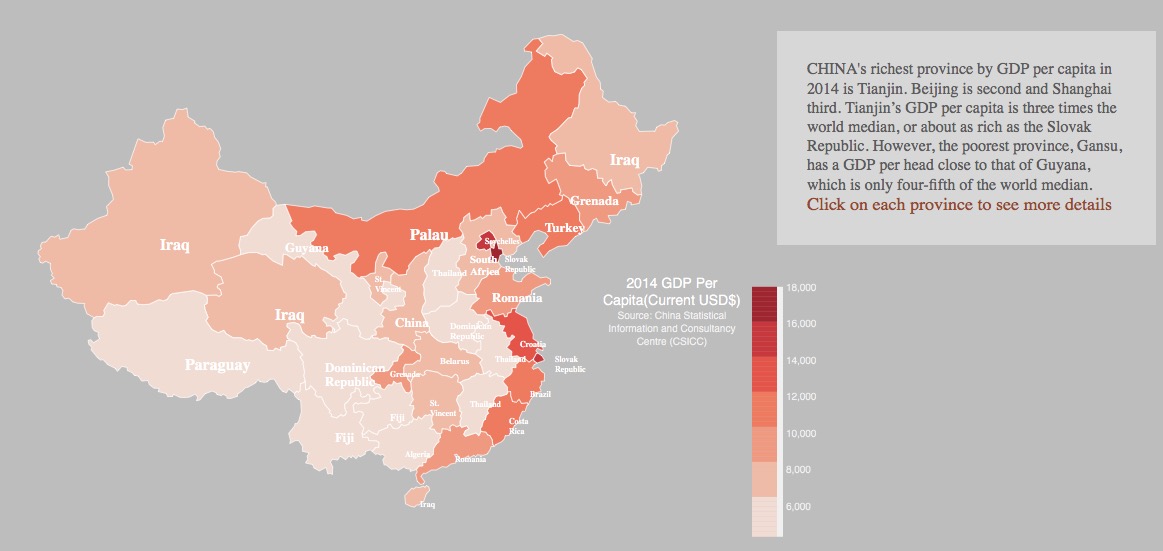
If China’s Provinces Were Countries
China is the world's second biggest economy, and some of its provinces by themselves would rank fairly high in the global league. Explore the nearest equivalent country for each provice for GDP per capita, unemployment rate, and life expectancy
Sources: National Bureau of Statistics of China and World Bank.
View ProjectJosh Chin
Movie Box Office, Critics’ And Audience Ratings
Which movies are making the most at the box office? And what did the critics and public think of them?
Source: Rotten Tomatoes.
View ProjectCandese Charles
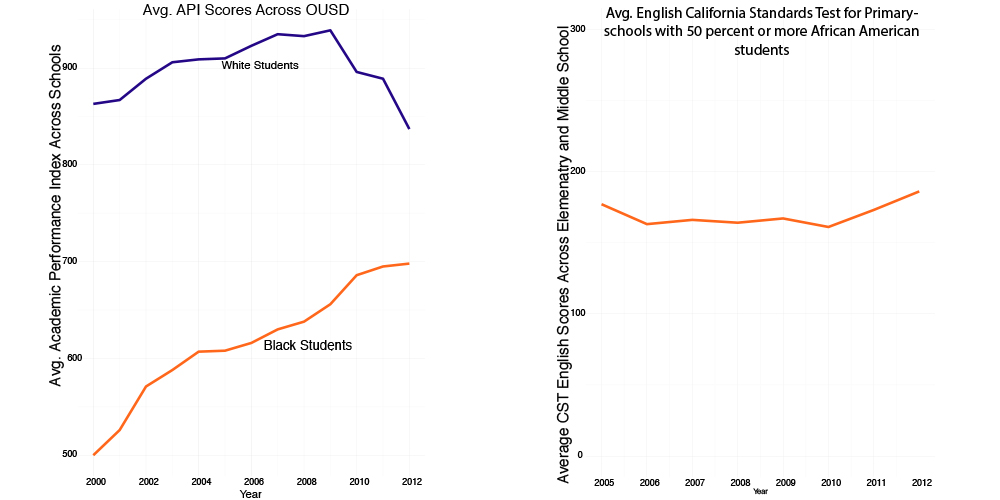
Academic Performance In Oakland Schools
Though African American students have low English test scores, their Academic Performance Index scores, which evaluate all subjects, are on the rise. These charts were used in a video piece about the history and present fight of education advocates in Oakland.
Source: California Department of Education.
View Project